Gold's Mid-Term Cycle + U.S. Stocks Update


 As mentioned in my prior articles for Gold-Eagle, the last low of significance for Gold was due to form into the late-May to early-June window. That decline was favored to end up as a countertrend affair, before turning back to higher highs into July or later - then to be on the lookout for the next mid-term top in the metal.
Gold's 72-Day Cycle
The 72-day cycle is currently the most dominant cycle for Gold. This cycle was recently projected to bottom-out around the late-May to early-June window.
Here again is that 72-day cycle for Gold:
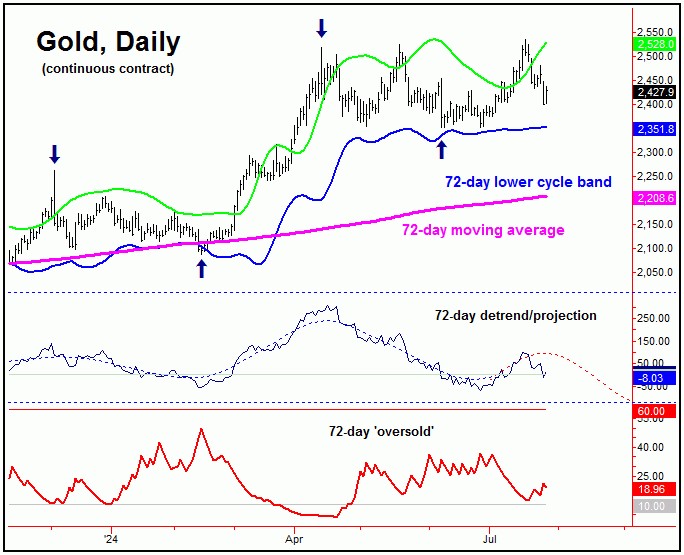
In terms of price, our ideal minimum price decline with this 72-day cycle called for a drop back to the 72-day moving average - which was hit back in June.
In terms of patterns, the correction with this 72-day wave was expected to end up as a countertrend affair, holding above the prior 72-day trough from back in February. This did end up as the case, with the path looking for a push back to higher highs here into July - which has also been seen.
With the above said and noted, there is the potential that our 72-day cycle has already topped - though this has yet to actually be confirmed, by taking a key downside reversal figure we are watching in our Gold Wave Trader report.
Until our downside reversal figure is taken out to the downside, there is still the potential for a push back to higher highs for the swing in the coming weeks - though time will eventually run out on this path, with another 72-day trough projected for mid-September of this year.
The 310-day Cycle
Above the 72-day wave for Gold, there is a larger 310-day cycle, which sets the mid-term trend for the metal.
Shown below is that 310-day cycle in the Gold market:
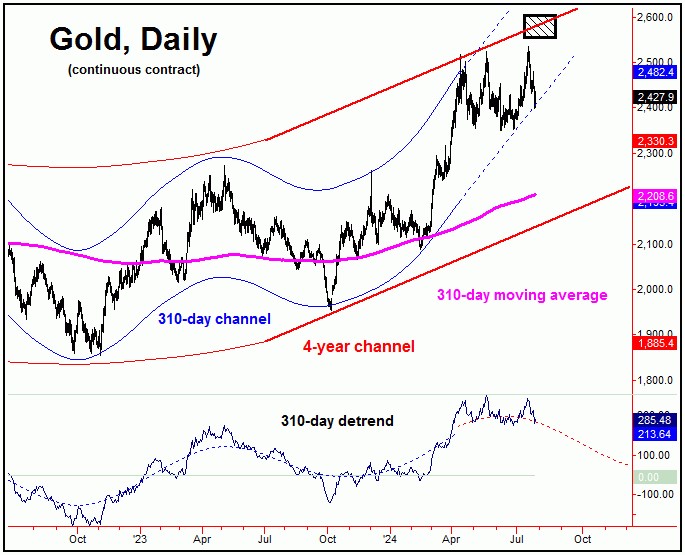
The last bottom for this 310-day wave was the October, 2023 trough. From there, this cycle was projected to push some 20-25% higher into the Spring/Summer of this year, before topping Gold for another decline into late-2024 to early-2025.
With the above said and noted, the current upward phase of the 72-day cycle has been expected to peak this larger 310-day wave. With the most recent action, as noted, there is at least the potential that this peak has already formed, though that is speculation for now - and has yet to actually be confirmed.
Adding to the notes above, there is a key momentum indicator that we track for the Gold market, which is called the Gold Timing Index - which is shown on the chart below:
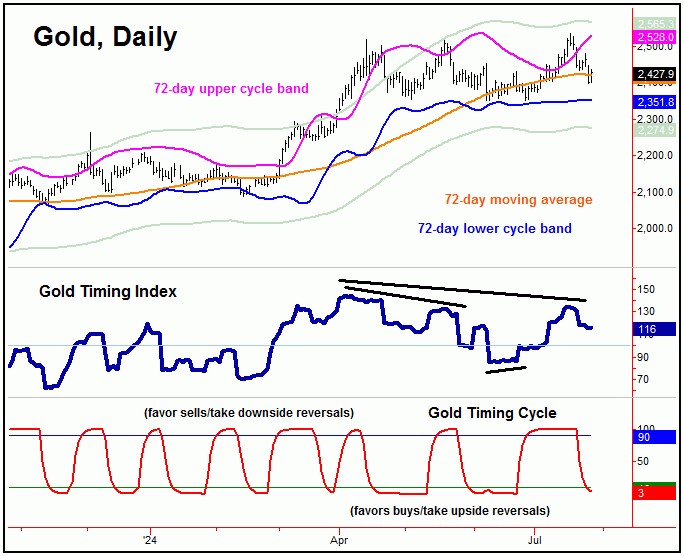
At each of the most recent swing highs for Gold, our Gold Timing Index managed to form a divergence - which is something we expect to see at a peak of 72-day degree or higher. With that, as mentioned, there is at least some potential for our 72 and 310-day cycle top to have already formed.
Having said the above, I have found that the best mid-term peaks for Gold will come from above the upper (gray) price channel - currently around the 2565 figure (December, 2024 contract). Since this has yet to materialize, there is still the potential for that to be seen, though time is now becoming key.
All said then, there are mixed indications at the present time. Having said that, what we can say is that either: (1) our 72 and 310-day cycle top has already formed, or (2) the next new high in price would be expected to peak these two waves.
Stepping back then, from whatever peak that does form with our 72 and 310-day cycles, the probabilities will favor a sharp decline playing out into the late-2024 to early-2025 window. In terms of price, the 310-day moving average and lower four-year cycle channel would be the magnets to that decline, as shown on our 310-day chart.
In terms of patterns, however, the next correction phase of our larger 310-day cycle is favored to end up as a bigger countertrend affair - holding above the prior 310-day trough, made back in October, 2023. If correct, a late-2024 to early-2025 bottom with this wave should give way to a very sharp rally into the Summer of 2025, with precise details of how rally will unfold always noted in our Gold Wave Trader market report.
U.S. Stock Market Cycles (Update)
In my prior article from late-June (i.e., 'U.S. Stocks Bracing for Decline'), I mentioned that a key cycle was topping, which is a semi-dominant 90-day cycle on the S&P 500 index.
This 90-day cycle for U.S. stocks is shown again on the chart below:
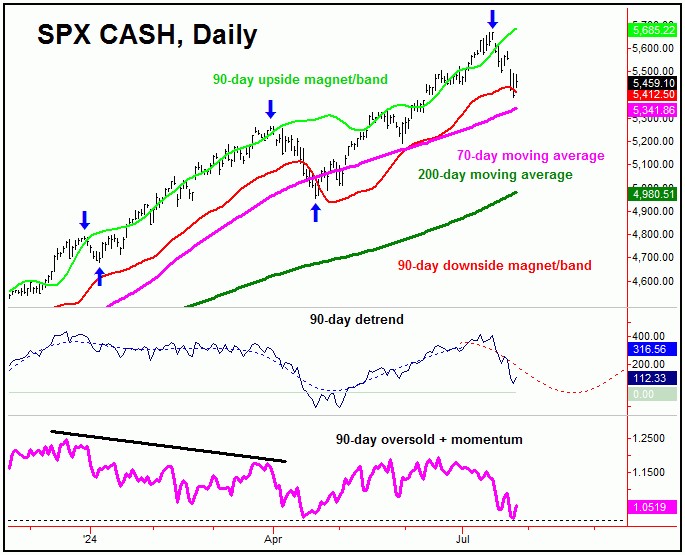
From my 6/23/24 article: "our cyclic detrend indicator suggests this 90-day cycle is going over a top, and with that is looking for its peak to form soon - with its next trough projected for the mid-August timeframe of this year. In terms of price, the 5560-5650 SPX CASH region - if tested in the coming weeks - is a major resistance level for this index. Once this wave does top, the 70-day moving average would be an ideal price magnet into that mid-August window."
As mentioned above, our 90-day cycle was moving into topping range, which was noted in our Market Turns report (which tracks U.S. stocks) as being the mid-July timeframe or later. The actual peak for this cycle ended up being made with the July 16th tag of 5669.67 on the SPX, which was just above noted resistance for this index.
Going further with the above, there is also a smaller 45-day cycle for U.S. stocks, which is seen as heading south, and is shown on the chart below:
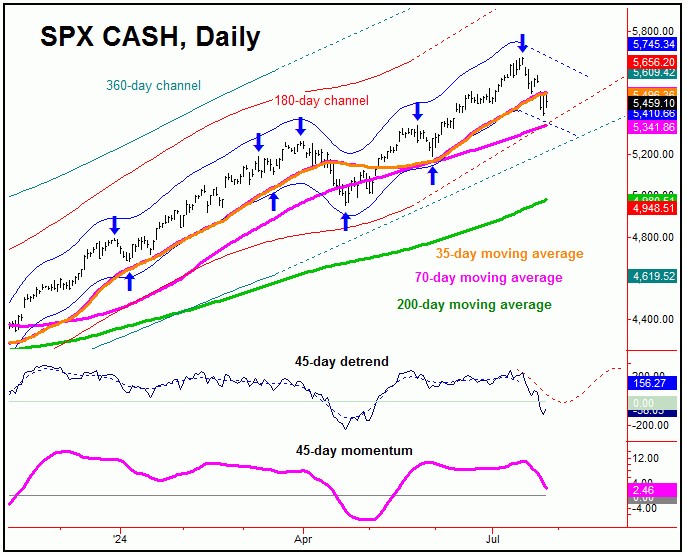
In terms of time, the detrend which tracks our 45-day wave is projecting its next trough to form into the early-August window, with the same detrend that tracks the bigger 90-day cycle projecting this to occur into mid-August.
With the above said and noted, we expect the next key low for U.S. stocks to form into the early-to-mid August timeframe. In terms of patterns, that bottom is anticipated to end up as a countertrend affair, and - if correct - should give way to new all-time highs, upon completion.
U.S. Stocks Sentiment
One of the key indicators that we track in our Market Turns report is a proprietary form of sentiment, with this indicator shown again on the chart below:
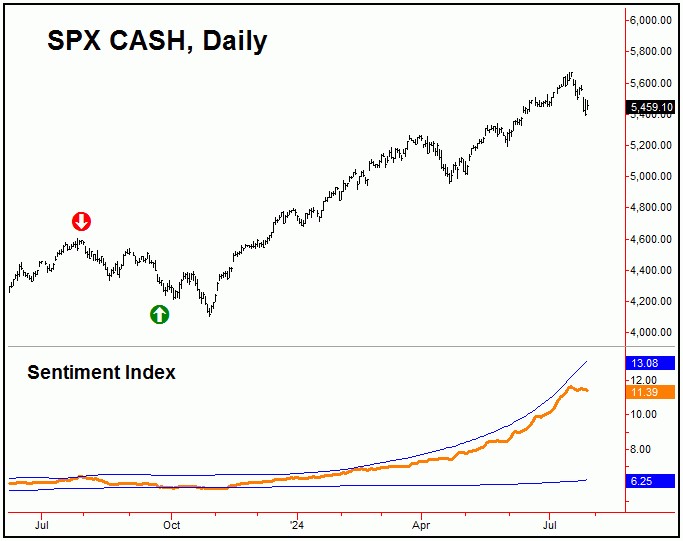
With the above said and noted, our stock market sentiment index last dropped below its lower 'buy' line at the 9/22/23 close of 4320.06 SPX CASH. This is a longer-term indicator, which has decidedly outperformed the SPX, since its inception back in 2014; in fact, we know of no other (mid-term) model that has performed as well.
Going further with the above, since it is a mid-term indicator, our sentiment index does not issue signals often - normally only once or twice per year.
With the action seen back into mid-July, our sentiment index did not move above its upper reference line - and thus no mid-term sell signal. The fact that this did not occur tends to favor higher highs (above 5669 SPX CASH) will be seen on the next larger upward phase - following the completion of the current 45/90-day cycle correction.
For the bigger view, we are anticipating that a sell signal with sentiment will eventually materialize in the coming weeks/months, though from what price level this will come from (and when) remains to be seen. Until then, it should be a 'buy the dip' mentality, though with the action expected to be volatile as we head into the November election.
Jim Curry
The Gold Wave Trader
Market Turns Advisory
http://goldwavetrader.com/
http://cyclewave.homestead.com/
********


