Mega Profitable Strategy For Next Heavy US Stock Market Down-Leg Believed Imminent
This morning we are going to look at an array of important factors pointing to another severe drop in the broad US stockmarket imminently, both factors external to it and indications on the charts for the S&P500 index (and other indices which we won’t have time to look at).
First it is well worth watching another classic video from Greg Mannarino posted yesterday: WOW.. ZERO Economic Activity in which he puts into words what many of us are thinking, and it’s worth watching this at least a couple of times. Rather amusingly, “The Dark Side” tried to buy Greg off to shut him up, but he wasn’t having it. This is how they operate – they buy you off, marginalize you, or take you out, whether you are an individual, a company or a country.
Now we’ll quickly look at related factors pointing another heavy drop by the stockmarket, and probably to new lows, before focusing on a way we can capitalize on this expected drop.
We start with the Baltic Dry index, which was one of the factors we used to predict the crash before it started. On its 1-year chart we can see that it cratered from September through February, and after a feeble bounce in recent weeks is dropping again…
Next oil, which as you all know has cratered, with Light Crude, shown below, dropping by a stunning two-thirds just this year. In the last Oil Market update, posted on the 13th, we forecast that it would break down from a bear Flag and plunge into the low $20’s, and that is exactly what has happened…
Lastly, Treasury yields are dropping again, pointing to (initially) deflation, that will be followed by rampant inflation, as Central Banks’ profligacy comes out the other end of the pipe. Observe how the 10-year yield plunged ahead of the stockmarket collapse in March. Then they recovered some, which helped to give rise to the big stockmarket bounce, but now they are ominously dropping away again…
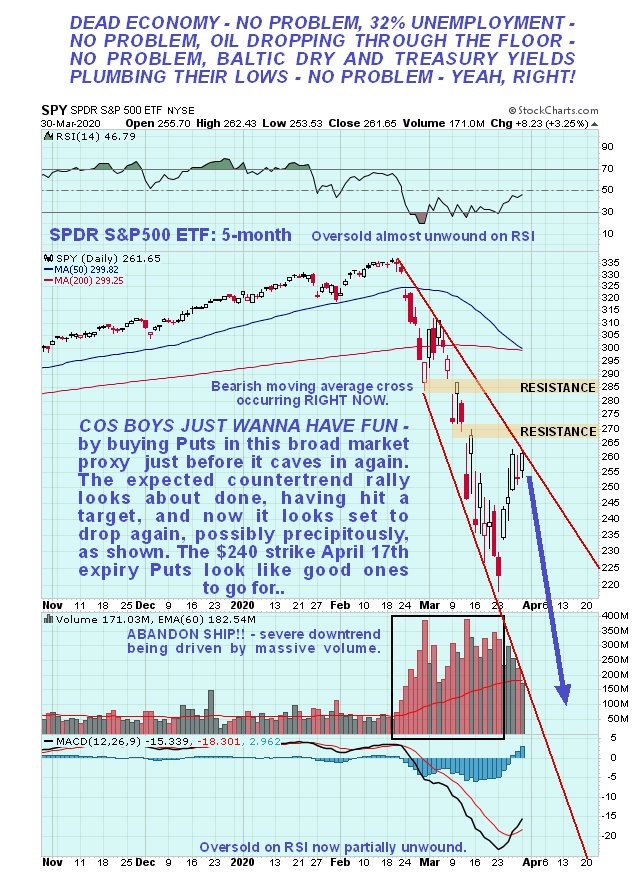
Turning to the stockmarket itself, we see on the latest 5-month chart for the S&P500 index that while the Fed’s big intervention stoked a massive short covering rally, it DID NOT break it out of our expanding downtrend channel, which now looks set to turn it down into a really severe downleg, made much more likely by the factors that we have considered above.
A way to capitalize on this expected drop, for those who are up for it, is to use the vehicle that we used before, the SPDR S&P500 Index ETF, which has options with good liquidity and narrow spreads. Since SPY is a close proxy for the S&P500 index, its chart looks almost identical…
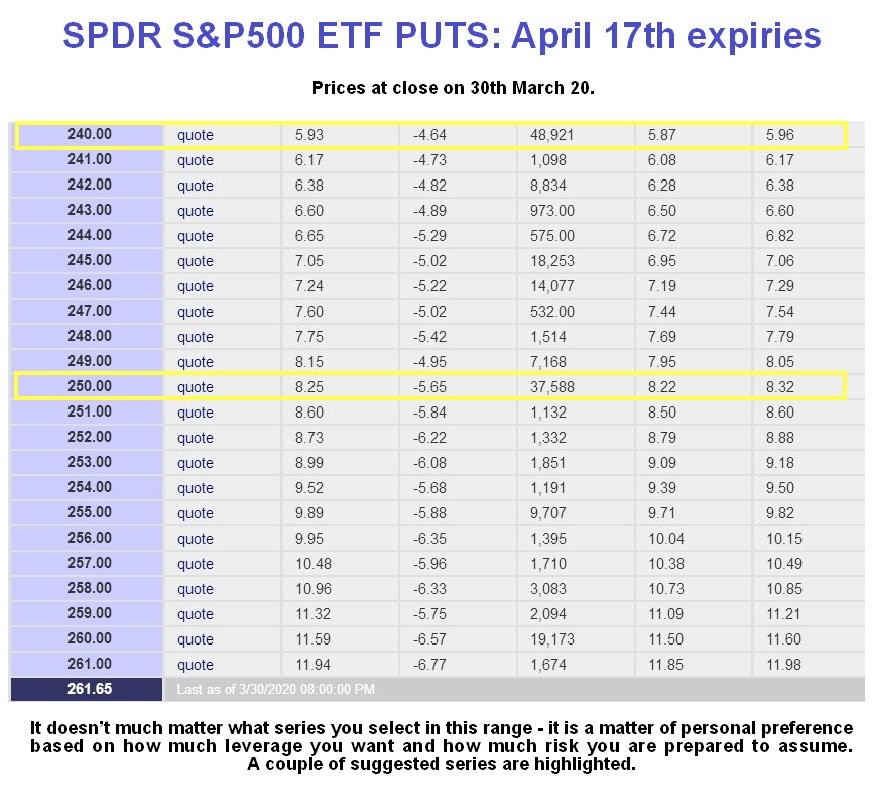
Below is a table showing suitable Put options in SPY. You can use any series to suit yourself, depending on how much leverage you want and how much risk you are prepared to assume. Note that there are more series available that are off the limits of this table. These options are only recommended for subscribers who have sufficient knowledge and experience to be comfortable trading them. They are obviously a high risk play, especially as, due to the current high volatility, premiums are high, but that said, if we get it right, we should still do very well with them.
Table courtesy of bigcharts.com
********


