The Most Frightening Chart in the Observable Universe


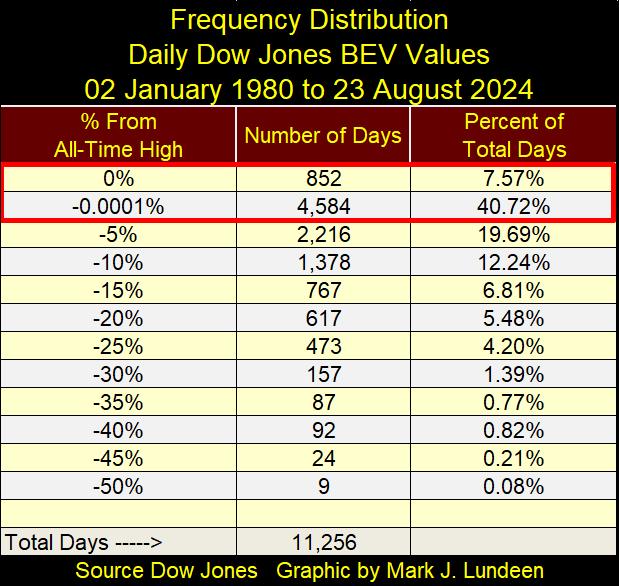
This week I’m using a Dow Jones BEV chart going back to 1980, to point out how many new all-time highs (0.00% = BEV Zero) the Dow Jones has seen these past forty-four years. Below the BEV chart, I have a frequency table, compiling the daily BEV values seen in the chart below. Since January 1980, the Dow Jones has seen 852 daily new all-time highs. Each of these BEV Zeros occurred only when the Dow Jones was in scoring position (BEV values -0.01% to -4.99%), which the Dow Jones closed in for 4,584 NYSE trading sessions since January 1980.
These sums for the BEV Zeros, and days in scoring position, are taken from within the Red Rectangle, surrounding the 0.0% and -5% rows in the chart and table below.
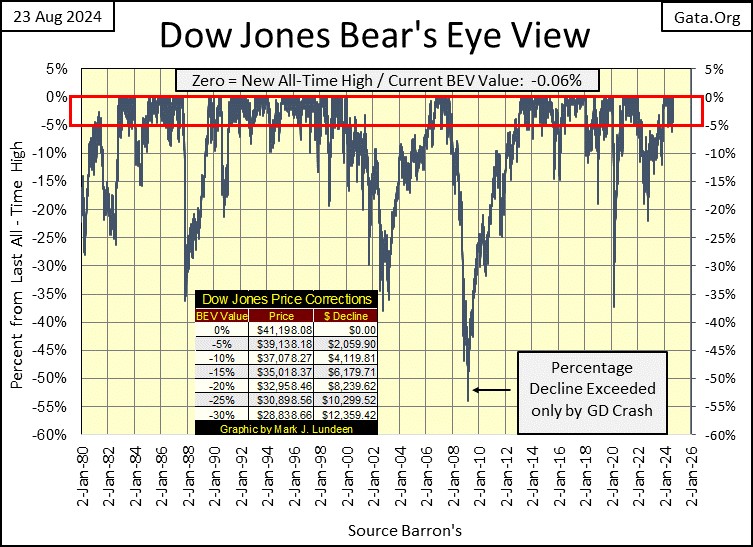
As seen in the freq table below, from the BEV data seen above, for the past forty-four years, the Dow Jones has daily closed at a new all-time high (0% row), or in scoring position (-0.0001% row) for 48.29% of its past 11,256 NYSE trading days. Another way of looking at this, is realizing the Dow Jones was situated to advance into market history, for half of its trading days these past forty-four years, and that just isn’t normal.
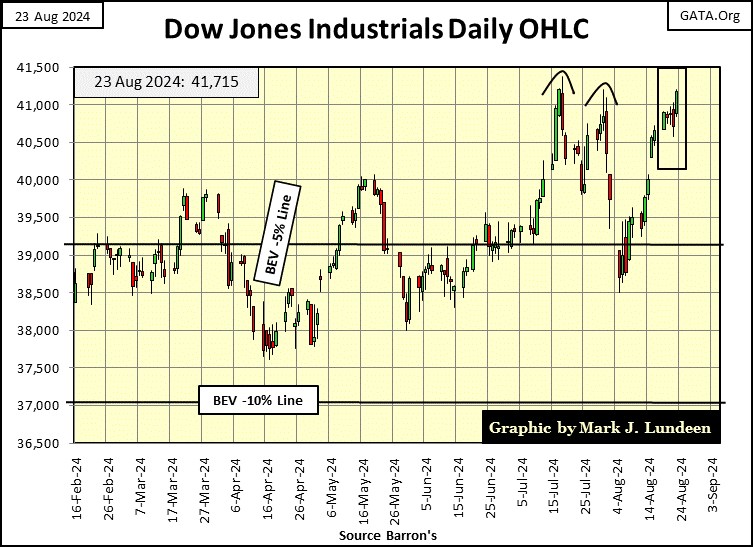
Below is the Dow Jones in daily bars. As of the close of this week, it’s obvious to my eyes the Dow Jones wants to soon close at a new all-time high, maybe next week, or the week after. What was the Dow Jones’ BEV at Friday’s close; -0.06%? The Dow Jones closed the week only 0.06% from making a new all-time high, only 23 dollars below its last all-time high. You bulls out there; what’s with that?
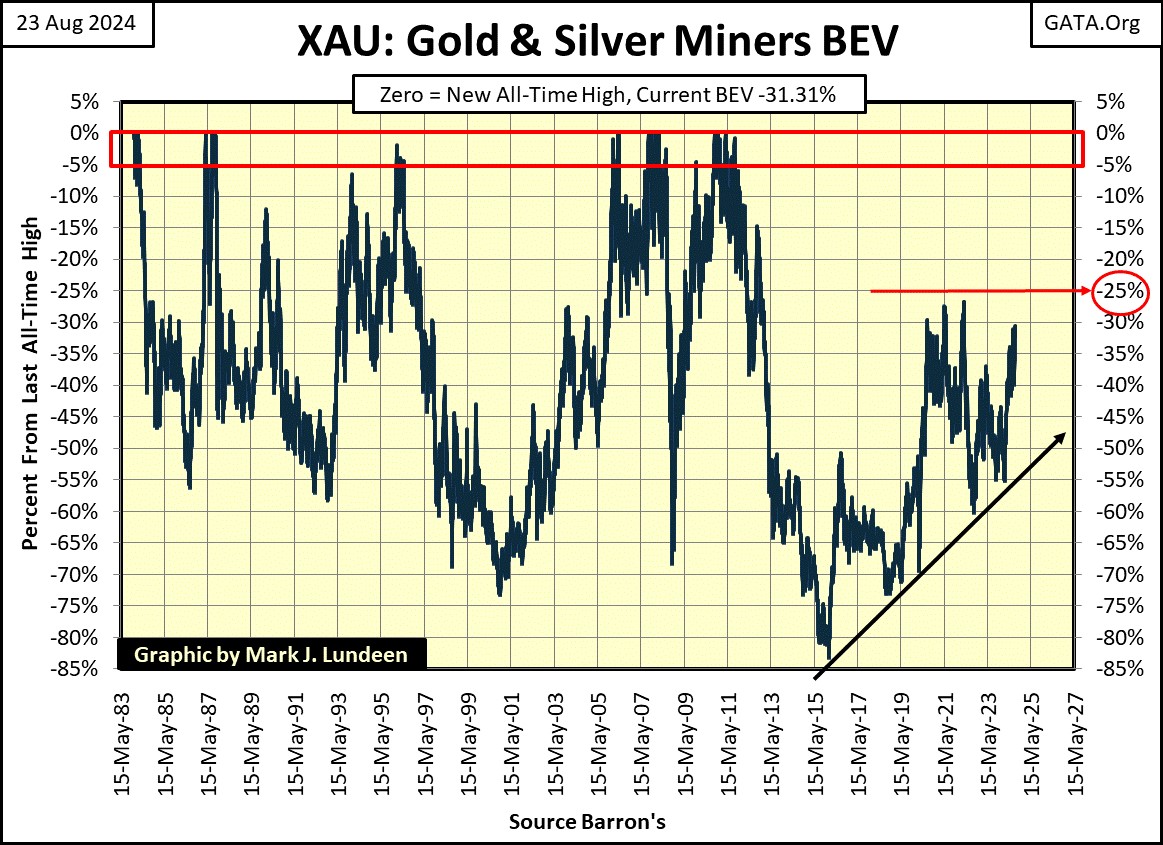
I note below the XAU is moving up to it BEV -30% line. It would have to close above its BEV -25% line (171.71), to confirm a breakout. It closed this week at 157.27. The XAU’s last all-time high was on 12 April 2011 (228.95), thirteen years ago. It’s about time we see some excitement in the gold and silver mining sector. It may happen this year.
Now compare the XAU’s BEV chart below, with the Dow Jones’ BEV chart above. Since 1983, since its creation, the XAU had seldom closed in scoring position, or made new all-time highs. The XAU is typically countercyclical to the Dow Jones; bad times for one is usually good times for the other, and that is exactly what we see when we compare the past four decades with these two BEV charts.
The day is soon coming when the XAU will make a new BEV Zero in its BEV chart below. Can that be a good omen for the Dow Jones?
Since 1980, it not just the Dow Jones seeing a super-abundance of BEV Zeros. Below is the NASDAQ Composite indexes’ BEV chart.
My daily BEV data for this series only goes back to December 1996, but we can see the tail-end of the High-Tech bubble, followed by a Great Depression like cratering of valuation, almost an 80% decline in the NASDAQ Composite. But since 2015, the NASDAQ Composite has been in scoring position most of the time, with lots of BEV Zeros, new all-time highs to show for it.
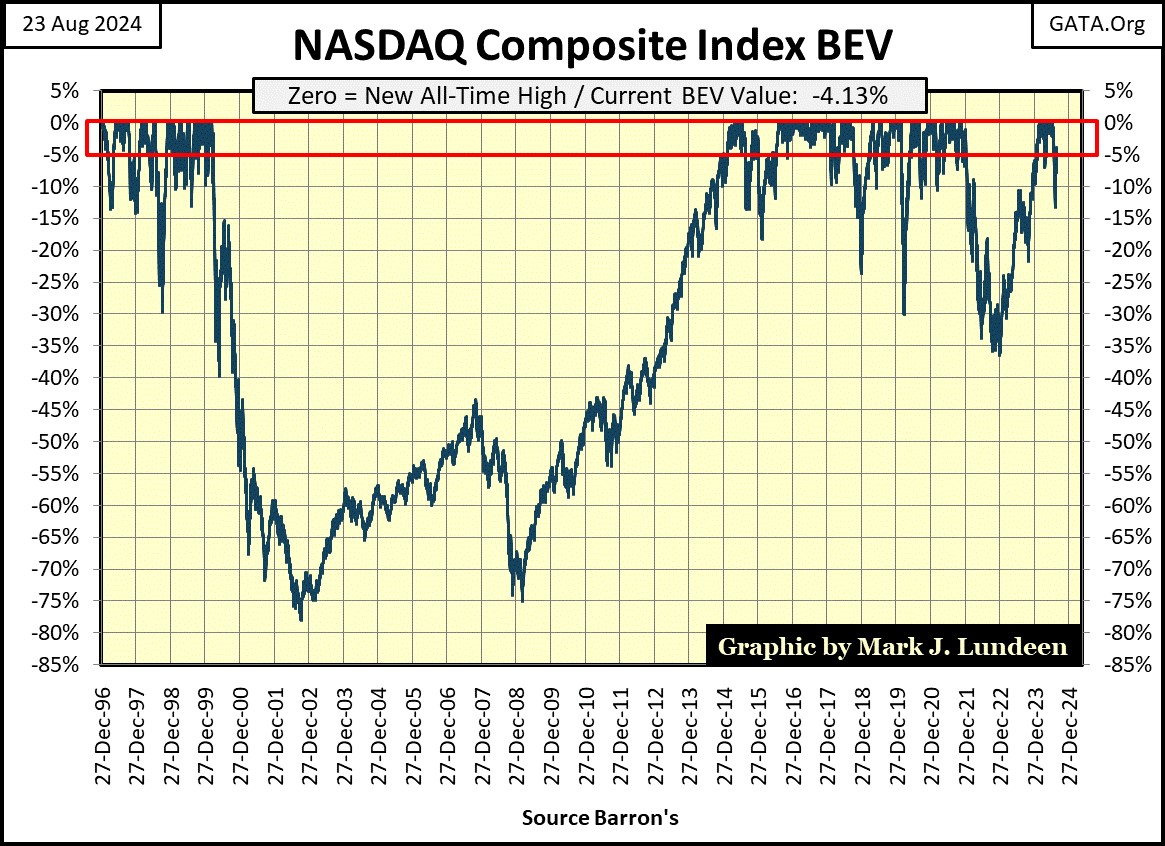
What did all these BEV Zeros, and closes in scoring position do for the NASDAQ Composite’s dollar valuation? On 27 December 1996, the NASDAQ Composite closed at 1,291.38. This week it closed at 17,877.79; up by a factor of 13.84. The Dow Jones during this same time was up by a factor of only 6.27, about half of what the NASDAQ Composite has done since December 1996.
This week in my table listing the BEV values for the major market indexes I follow, once again we see some new all-time highs. At Friday’s close, six of these indexes closed at a new all-time high, the next eight closed in scoring position. For the bulls, this was a good week. Obviously, “liquidity” from somewhere, I couldn’t say where, is flowing into the stock market.
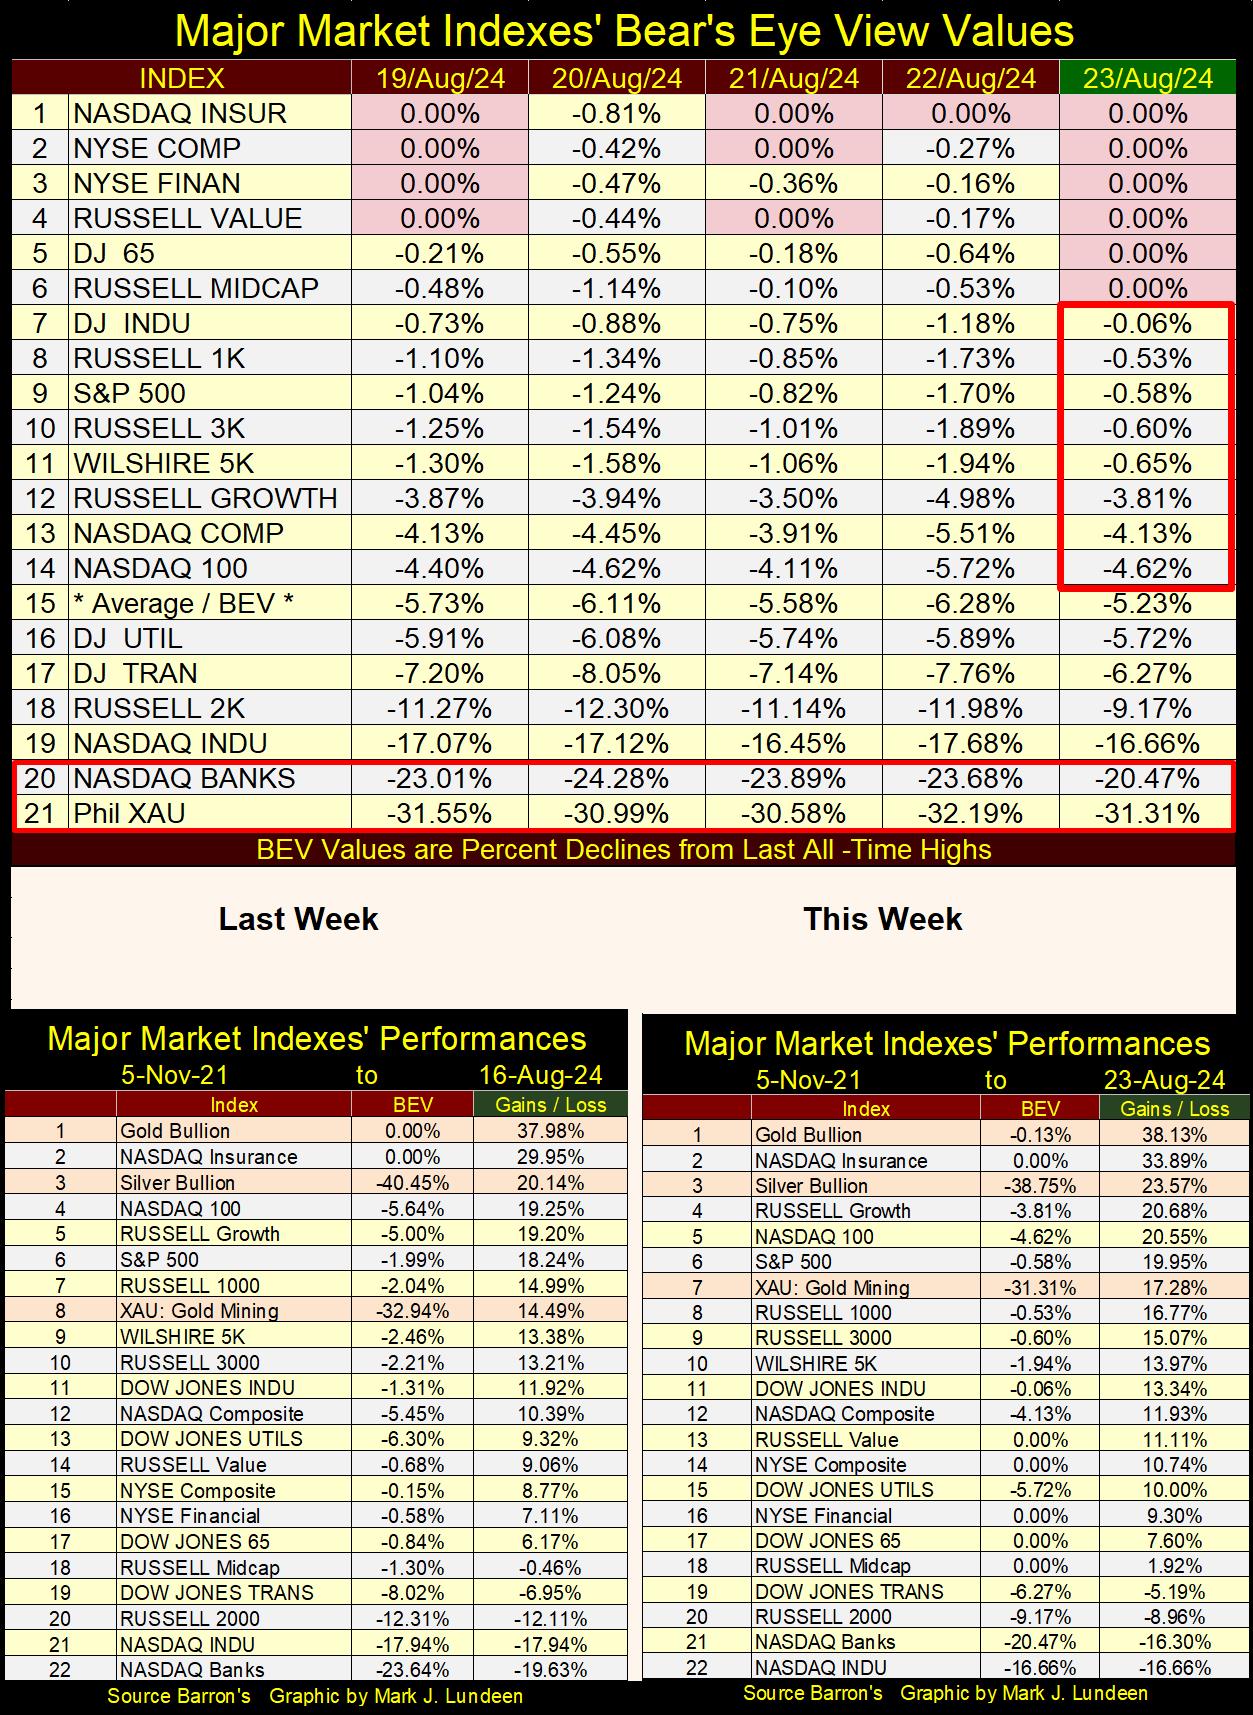
In the performance tables above, most of the indexes advanced nicely this week. As usual, gold kept an iron hand on the #1 spot, with silver keeping its #3 position. Good seeing the XAU jumping up a row this week, from #8 to #7 this week. If the gold and silver market gets really hot, and it will, expect to see the XAU take the #1 position from gold.
Jackson Hole, Wyoming is a very beautiful place, especially so in August. It’s a shame how every August the “policy makers” migrate in mass to this lovely spot, to do what they always do; make a mess of things.

This week at Jackson Hole, Idiot Primate Powell hinted he was going to lower interest rates, but no guarantees on when, or by how much. Reading between the lines, “depending on incoming data,” the FOMC may have to increase interest rates.
So, why did the “policy makers” meet this week in Jackson Hole, Wyoming, if this was all Powell had to say? I already told you; in August, Jackson Hole, Wyoming is a very beautiful place to be.
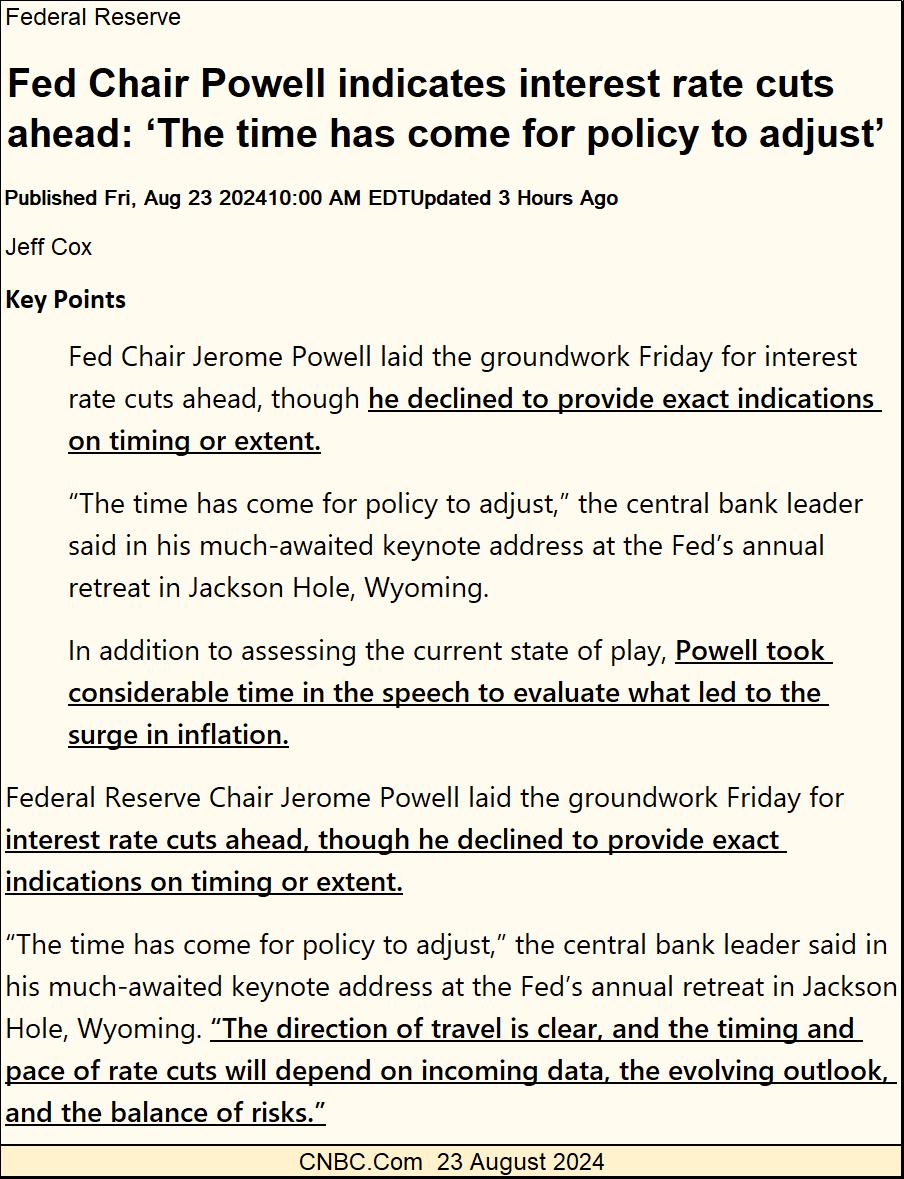
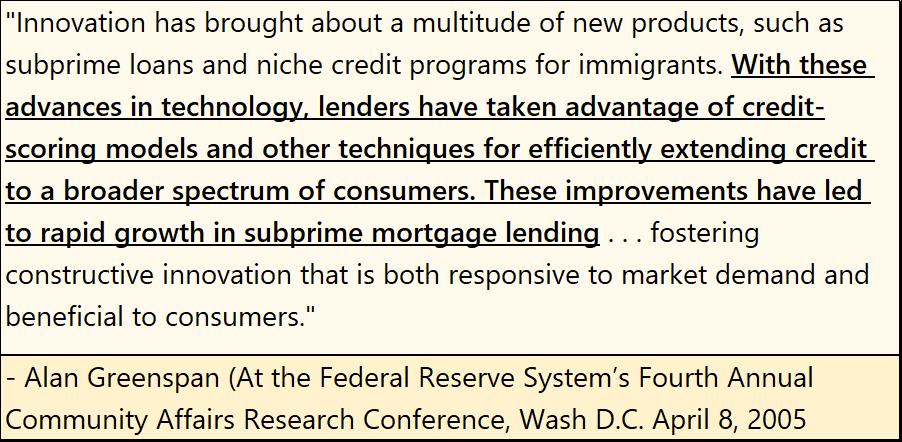
These dictators of “policy” say lots of things in their interviews with the main-stream media. However, I’ll believe it when I see it. I note in the press release above, Powell spent a considerable amount of time “evaluating” what led to the surge in CPI inflation.
I don’t know why he would do that. All he had to do was show the following chart of the Federal Reserve’s balance sheet below, to tell the whole sorry story of our current inflationary woes, with no more effort than with a blink of the eye.
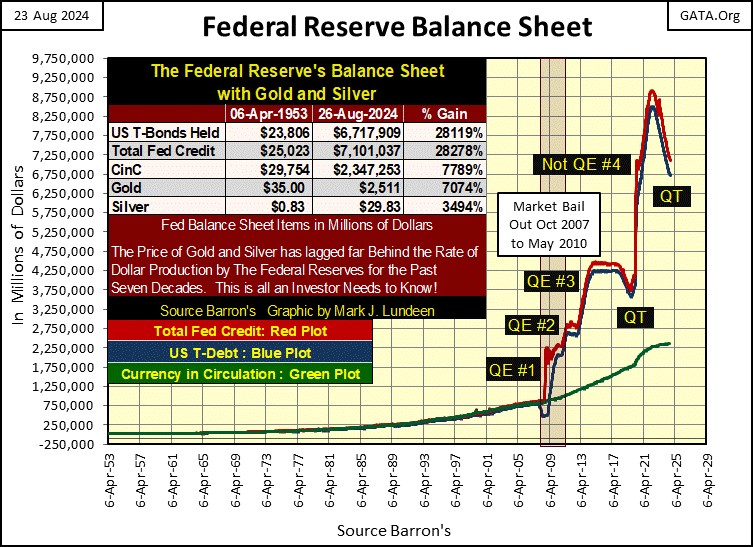
Look at the FOMC’s current QT. They’ve reduced their balance sheet by a few trillion dollars, and the stock, bond and real estate markets aren’t in major bear markets? How is that possible?? These idiots somehow, some way must be cooking the books.
Remember in the late winter / early spring of 2022, how the talk in the financial media was that the FOMC was going to have a QT to withdraw some “liquidity” from the financial system? Now in August 2024, it’s been a long time since anyone in a position of power, or influence has mentioned this ongoing QT, where each week the FOMC announces the reduction of their balance sheet by billions of dollars.
I publish these charts, charts based on data from the FOMC. But as time goes by, I’m beginning to believe these numbers are just propaganda for people like me, people who foolishly follow their weekly published data, as if it means anything.
Another week, another article. What to write about? It’s this way every week; I sit down in front of my computer and wonder; what in the heck am I going to write about now? People, including myself, like to learn new stuff, because it’s exciting. However, after the new material is absorbed, it then becomes boring, making my efforts to write about the same old stuff, year after year, a challenge if I’m to keep my readers’ attention.
Let’s take the following about “global warming” as an example. CO2 emissions from human industry will make the oceans boil by 1999, as “scientists” told us in the early 1980s, or by 2050, as “science” now knows for a fact today. We’ll all be dead in twenty-five years, talk about exciting!
Or so one would think. But dwelling on giga-death decades from now, and taking it to the streets to protest fossil-fuel consumption, demanding humanity’s return to simpler times when poverty, and early death from infection and disease, was a reality in everyone’s life. And worse, back to a time when digital-social media was not possible due to lack of the availability of electricity. These woes brought about by rising CO2 levels, can keep the attention of even the most progressive of individuals for only so long. So now, this global warning stuff is boring.
But fortunately for you and I, there is one old, and very moldy chestnut that never gets old when read or written about, over and over again, at least not to me. What the idiots at the FOMC have been doing for over one-hundred years; inflating the supply of dollars-in-circulation to the point where the dollar is now almost worthless. If you want to go to a fast-food joint to by a few hamburgers, some fries and a cola, these days you best bring $20, or not go at all.
As dictators of “monetary policy,” they have also inflated massive booms in the financial system, to then popping these same bubbles, producing some epic market busts. The Dow Jones 89% market decline from 1929 to 1932, and the NASDAQ Composite’s 80% bear market decline seen in its BEV chart above, are only two of these many financial disasters these idiots have created.
Before we look at what the idiots are doing to us now, let’s first look at what they did to our ancestors long ago. Below is a Bear’s Eye View of the Dow Jones from 1885 to 1959, where every new all-time high registers only a 0%, and never more. All daily closes not a new all-time high, registers as a negative percentage claw-back from its previous all-time high.
Congress, on Christmas Eve 1913 had a super-special, super-secret session, unknown to most Members of Congress, who would have voted no to the creation of the Federal Reserve System, had they been there. But on Christmas Eve 1913, as Santa was busy delivering Christmas gifts to children everywhere, those members of Congress who would vote yes to the Federal Reserve System were in session, and that is how we got the Federal Reserve; by a dirty trick.
The impact this legislation had on the Dow Jones (the stock market) can be seen below, in the blue BEV plot from 1885 to 1921. Wall Street was a wild place before its valuations were “stabilized” by the idiots.
From 1890 to 1921, the Dow Jones saw six 40% bear-markets declines, nothing like that since 1921. These big bear markets had a positive side to them; everyone long ago knew debt was like a loaded gun; dangerous and so must be treated with respect. People and businesses strived to maintain a strong, debt free balance sheet to the best of their ability, because they know the consequences if they didn’t, on the next big market decline.
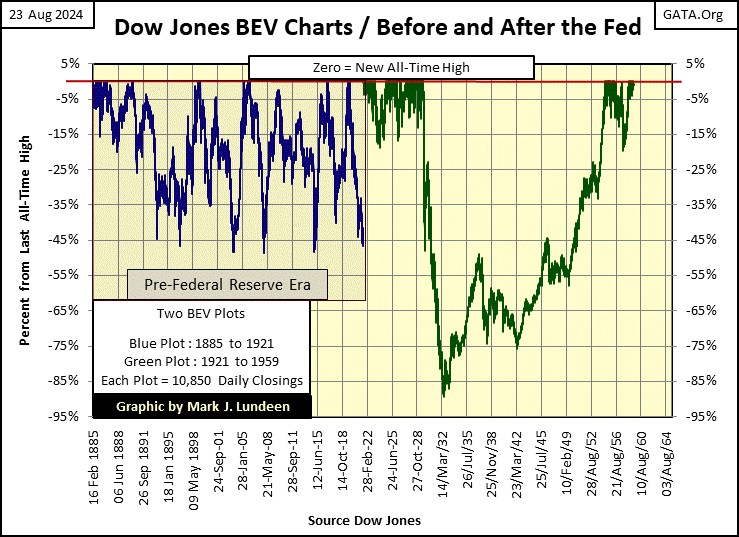
This respect for debt changed in 1921, when the Federal Reserve finally got around to “injecting liquidity” into Wall Street, via margin debt. It’s not hard seeing exactly when that happened in the chart above; look at all those BEV Zeros in the 1920s, without a 20% claw-back by Mr Bear.
The Roaring 1920s was a boom time. Bootlegged liquor from Lucky Luciano and Big Al Capone, and cheap credit flowing from the Federal Reserve provided the entertainment. Massive bubbles inflated into the stock market and Amerian real estate made many people, who were deeply indebted to the Federal Reserve System, feel rich – but in fact they weren’t. Then came the depressing 1930s.
Life was good, as seen in the Hollywood movies of the 1920s. Consumer credit was also invented in the 1920s, something that didn’t exist before the Federal Reserve began making credit available for washing machines and auto loans. This is what is so special about the Federal Reserve; they are always probing for new places to “inject” their “liquidity” into;
In the BEV chart above, the green plot for the 1920s looks very different from what it did before, because the Federal Reserve inflated a bubble into anything, or anyone, who was willing to “buy now / pay later” with bank credit flowing from the Federal Reserve System.
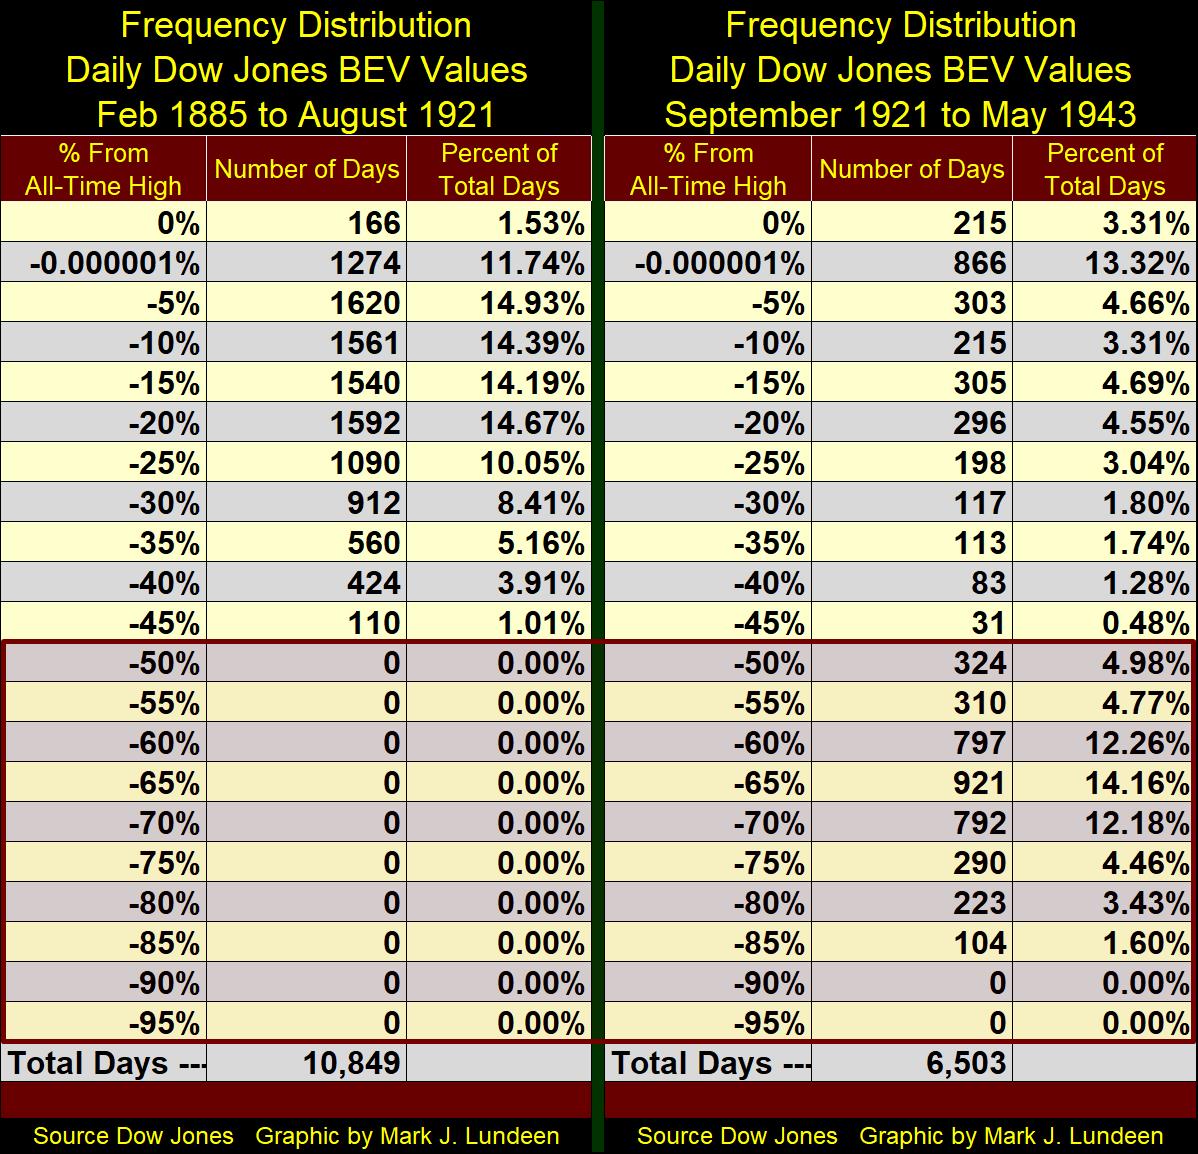
The BEV Frequence Tables below, use the BEV data seen plotted above to May 1943. Before August 1921, the Dow Jones never saw a bear market decline of 50%. After the bubble popped in October 1929, not until 1952 did the Dow Jones see a BEV of -25%, or greater. But this was before the Congress gave the idiots new tools, like quantitative easings to “stabilize market valuations.”
Above is a quick summary of what the idiots have done, but what are they doing to us now? They are doing the same thing they’ve been doing since August 1971, when they terminated the dollar’s $35 gold peg; inflating a massive bubble in the stock market, as well as many other places in the economy. But unlike for student and sub-prime auto loans, I have the graphics for the stock market. So, let’s look at the Dow Jones from 1900, to today’s close in the chart below.
Below is what must be the most frightening chart in the observable universe. Well, it is! Go ahead, look far and wide, from the Orion molecular cloud complex, to the far side of the Virgo super-cluster. Nothing, no black hole or neutron star poses a greater threat to life on this Earth, than does the bubble seen inflated into the Dow Jones below; my proxy for the broad-stock market. When this bubble goes pop, your life will never be the same, in a very negative way.
Of course, the idiots can once again “stabilize market valuations” with yet another of their QEs, or a series of them, and we’ll then soon see the Dow Jones trading over 70,000, a mere advance of 75% from current valuations. Should that happen, be ready to bring $100 to buy a few hamburgers, fries, and a coke.
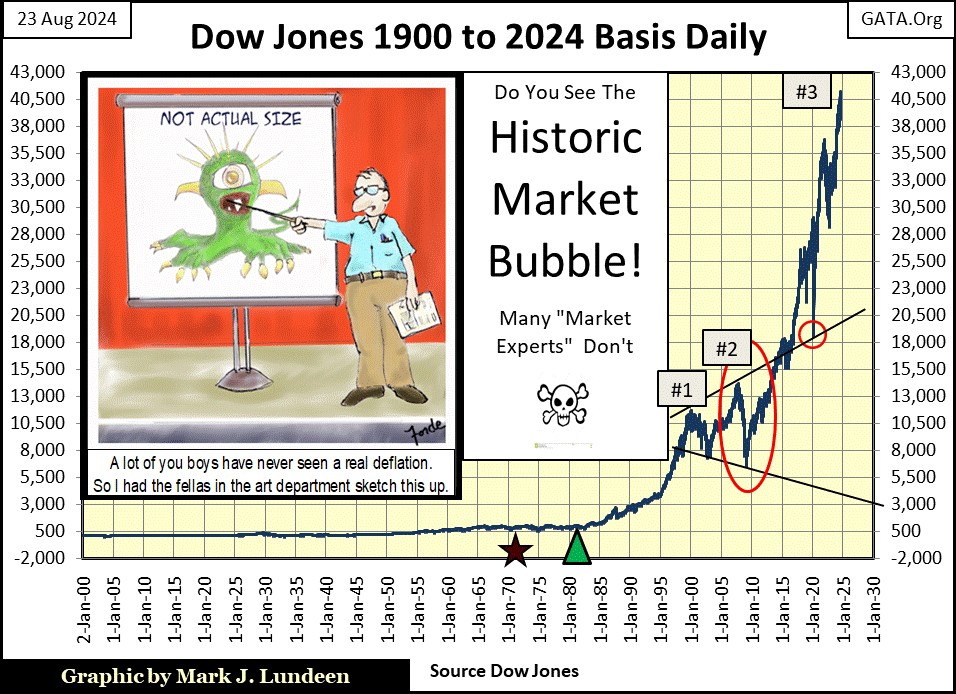
Let’s look at some key events in this bubble’s creation seen in the chart above;
- first the Red Star; where in August 1971, the idiots terminated the dollar’s $35 gold peg, allowing them to create unlimited currency and credit,
- next the Green Triangle; the August 1982 beginning of the massive bubble seen above,
- Peak #1; the Dow Jones’ top for the NASDAQ High-Tech bubble, which was followed by a 38% bear-market bottom,
- Peak #2; the Dow Jones top for the Sub-Prime Mortgage bubble, followed by the 54% bear-market bottom, the second deepest bear-market percentage decline in Dow Jones History,
- Small Red Circle; the bottom of the March 2020 Flash Crash, the triggering event for FOMC Idiot Primate Powell’s massive “Not QE#4,”
- Peak #3; the consequence of allowing a bunch of idiots to “inject” over seven trillion-dollars, via three QEs, and one Not QE, into the financial system. See Fed’s Balance Sheet chart above.
So much depends on this inflationary bubble called the stock market. When this bubble goes pop, the plans of people and financial institutions depending on it will all have to be reevaluated, to the downside.
What is someone to do? First realize at the bottom of this pending disaster is what is called counterparty failure. Where debtors find it impossible to pay back their creditors, and investors discover the high prices their favorite stocks see today, will be greatly reduced sometime in the future during a massive bear market.
At times such as these, assets like gold and silver bullion, assets with no counterparty risks, should become a significant percentage of one’s personal wealth.
So, lets now go on to gold’s BEV chart below. This BEV chart covers the gold bull market since it began in February 2002, when gold bottomed at $253 an ounce. You may wonder, why was gold selling for $253 an ounce?
Because in February 2002, no one was willing to pay $254 for an ounce of gold! Now in 2024, with gold selling for over $2500 an ounce, that sounds funny, but it is true. However, in February 2002, $253 an ounce gold was a fact at the bottom a two decades long, bear market in gold. A time when no one boasted they were buying gold at $253, for fear of being ridiculed.
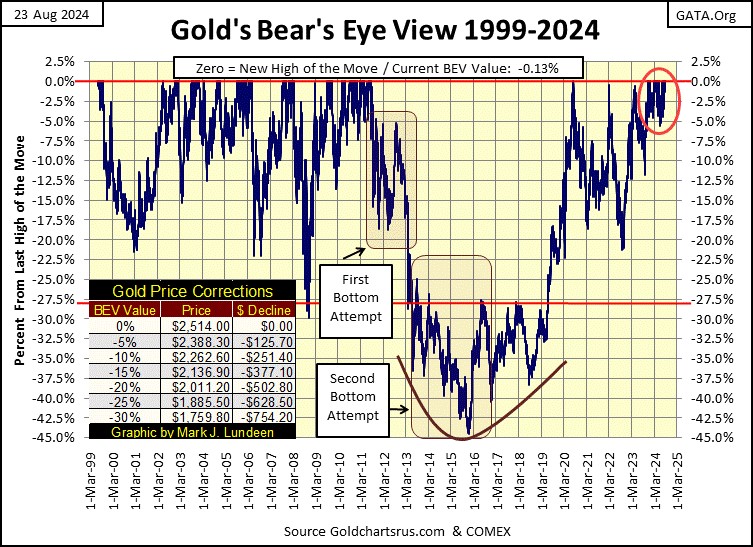
Note on gold’s BEV chart above. I started this BEV series in July 1999, so until November 2007, this chart’s BEV Zeros are only new highs of the move. After November 2007, all BEV Zeros are new all-time highs in the price of gold.
The above BEV chart for gold is one hell of a strong chart, one screaming for higher gold prices in the months and years to come. We had a massive 45% bear market from August 2011 to December 2015, that shook the weak hands out of the gold market. Most of these people still haven’t returned, still fearful of losing money in gold. Most certainly will return, but only when higher gold prices make them feel safe. This is good, as it’s an indication of how young this bull market is.
From August 2011 to October 2023, gold saw only three BEV Zeros, in August 2000. But note how since November 2023, when gold entered scoring position, and has stayed there to this day, gold has developed its first cluster of BEV Zeros (Red Circle) in a long, long time.
After over a decade of drought of new all-time highs, the gold market is finally seeing it rain BEV Zeros. Gold has seen twenty-seven daily BEV Zeros since last November. Need I say that’s good? Looking at this chart, I believe many more are coming.
A few weeks ago, I began comparing gold’s BEV chart with the Dow Jones’ BEV chart, as they have been so similar these past few years, which is something not to be expected.
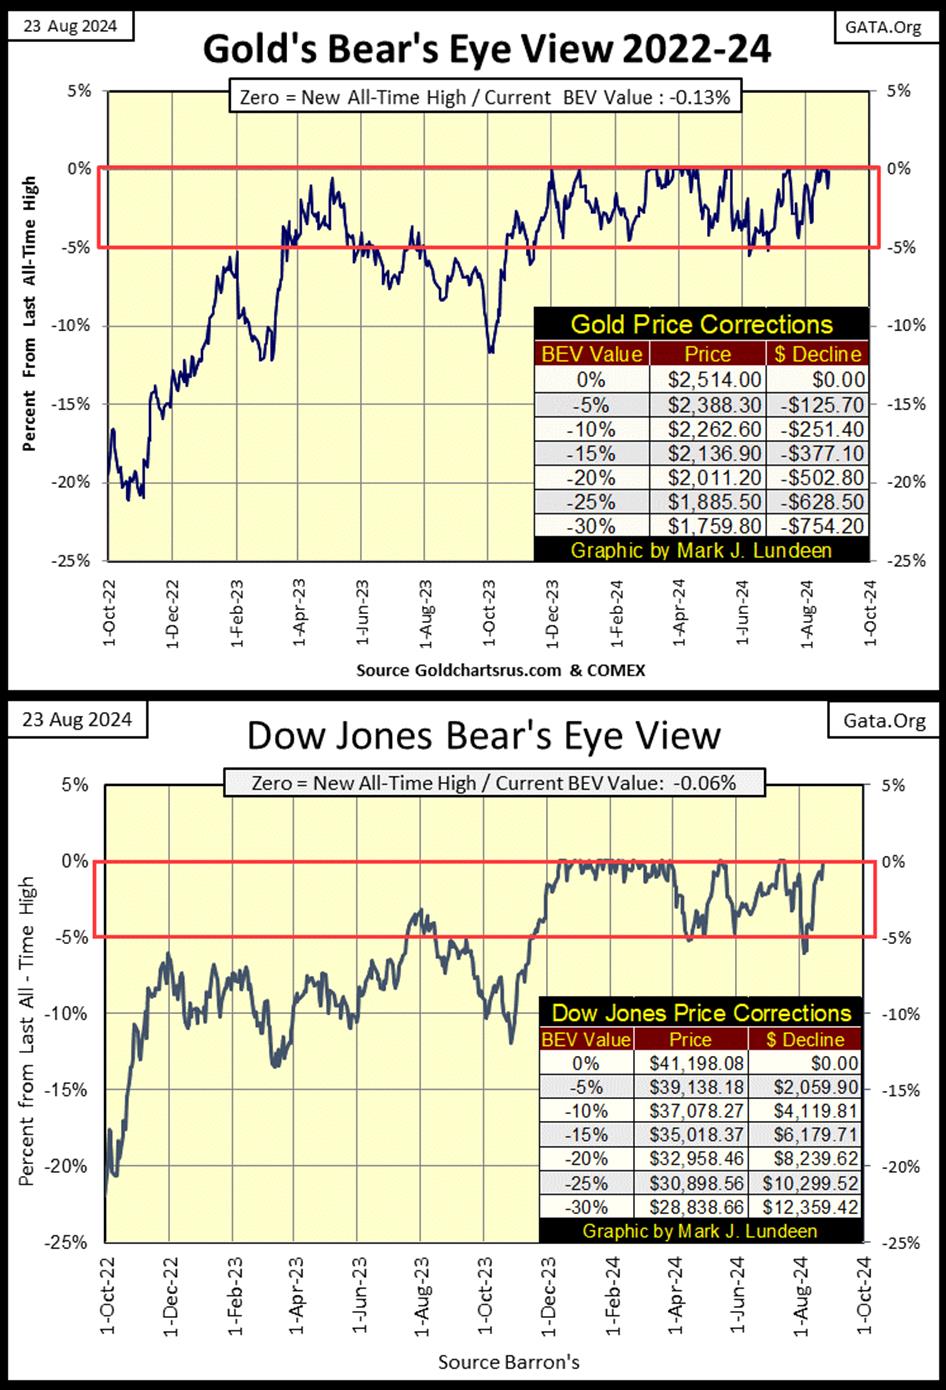
As seen above, both gold and the Dow Jones closed the week just a hair away from their next new all-time high. Someday, one of these market series is going to diverge from the other, and plunge deep below its BEV -20% line. But after two years, I’m not holding my breath until I see which of them does.
Below, gold in its step sum table is looking great. We see three BEV Zeros in the past two weeks; #25-27, from the advance that began last November. Gold’s 15-count closed the week at +1, meaning gold isn’t overbought; not with all those down days separating the new all-time highs. The only thing lacking for gold, is its daily volatility’s 200D M/A hasn’t yet begun trending towards 1.00%. But one day it will, and that is when things will get exciting in the precious metals markets.
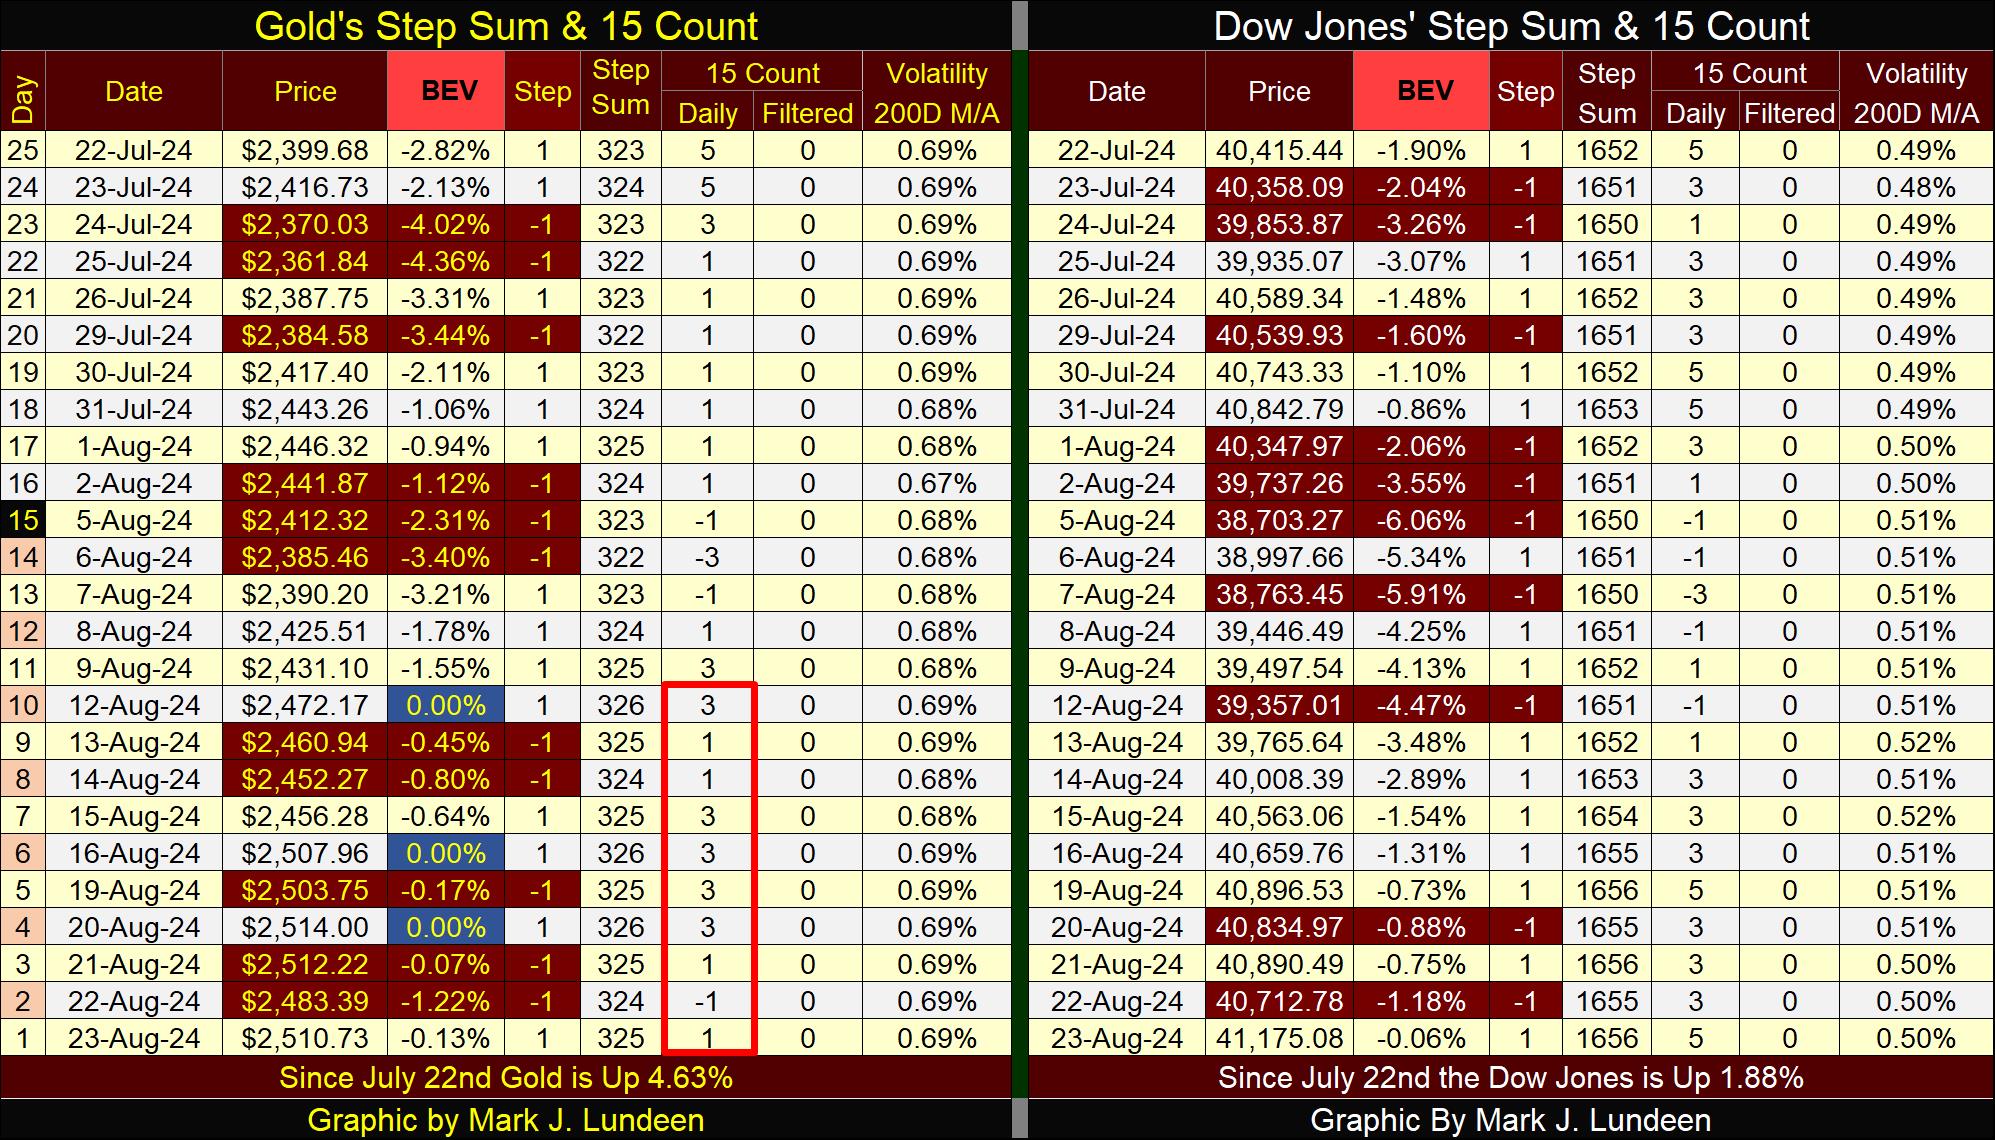
The Dow Jones is also looking good in its step sum table. No new BEV Zeros since July 22nd, but I expect we’ll see that corrected sometime next week. Considering the Dow Jones has to advance only $24 from Friday’s close, its hard imaging it won’t. The Dow Jones 15-count closed the week at a +5, still neutral, but it’s getting up there. The Dow Jones daily volatility’s 200D M/A continues to be low, far from the critical 1.00% level, and that is a big positive for the stock market.
Mark J. Lundeen
*********


