No New Highs For Gold Since 1980


 ALL-TIME HIGHS FOR GOLD
The price of gold closed at $2578 oz. on Friday. As has been the case for most of this year, the financial media, particularly the gold space, treated us to a barrage of headlines regarding "new, all-time highs" for the yellow metal. It seems we hear this phrase almost daily now. Yes, it is technically correct; but, is it meaningful information?
For example, if gold closes at $2579 oz. next week, it will also be a "new, all-time high". So what? You can bet that the noise level will increase disproportionately to the price action with any further upside. A better understanding of gold's price action might be more useful to investors. Below is a chart which depicts the price action of gold since 1971...
Gold Prices - 1971-2024
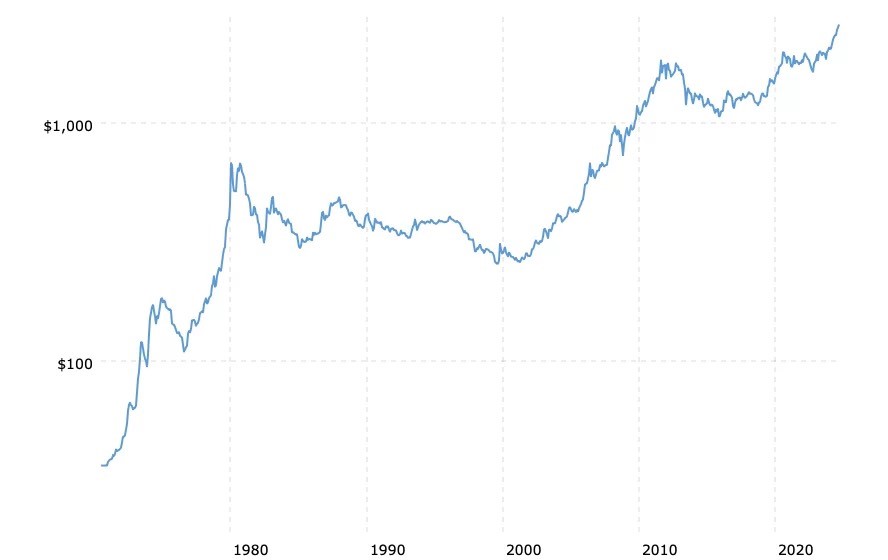
The chart above shows the long-term appreciation of the gold price beginning at approximately $35 oz. in 1970 and ending at the most recent closing price of $2578 oz. Looking at the slope of the uptrend, it is apparent that we can argue "new, all-time highs for gold" intermittently over the years and be factually correct.
It is important to point out, however, that there are significant declines in the gold price over long periods of time. Most notable is the period from 1980 to 1999. Even after the price began moving up, it was several more years before the old high was eclipsed. The next peak for gold finally came in 2011, thirty-one years after the 1980 peak.
Nevertheless, the gold price has risen from $35 oz. to $2578 oz., a 73-fold increase, over the past fifty-four years.
Now, here is a second chart for the same time period except that the prices have been adjusted for the effects of inflation...
Gold Prices (inflation-adjusted) 1971-2024
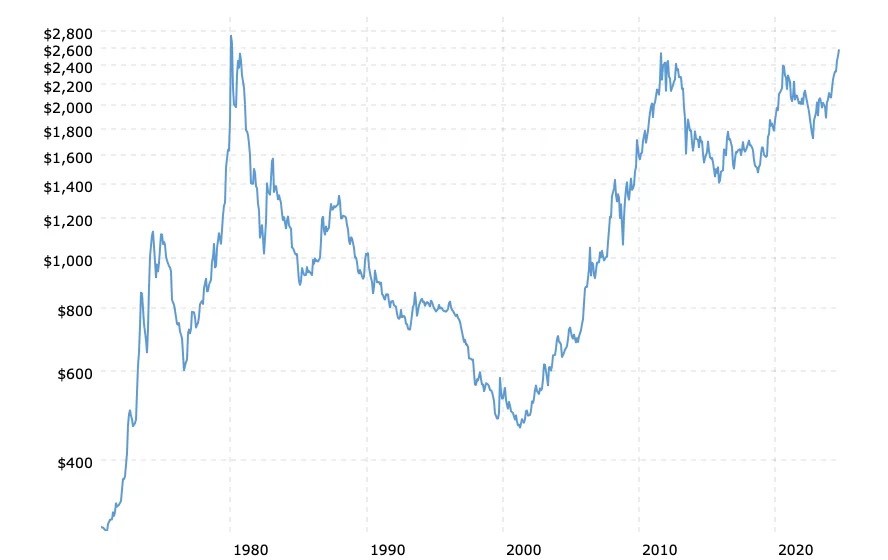
Two things in particular stand out on the chart immediately above: 1) The ascending uptrend shown in the first chart is now visibly altered in a negative way; and, 2) THERE HAVE BEEN NO NEW (REAL) HIGHS IN THE GOLD PRICE SINCE 1980.
When the gold price peaked in 1980, it reflected several decades of U.S. dollar depreciation. At a monthly average closing price of $677 oz., the gold price correlated to a 97% loss in U.S. dollar purchasing power.
Subsequently, when the gold price peaked in 2011, more than thirty years later, the monthly average closing price was $1825 oz., which represented a nearly 99% loss in USD purchasing power. All of the nominal price increase from $677 (1980) to $1825 (2011) accounted for the effects of inflation (loss of USD purchasing power) that had occurred between 1980 and 2011.
By 2020, with the gold price having risen to a new peak closer to $2000 oz., a full 99% loss of USD purchasing power was confirmed. The additional increase in the gold price between 2011 and 2020 is reflective of the additional loss of USD purchasing power that occurred between 2011 and 2020.
Gold's price increase this year, after breaking the $2000 peak first reached in 2020, accounts for the loss of USD purchasing power that has occurred since 2020.
PRICE TABLES
Below are two tables with the actual, nominal prices shown on the charts above; and, in parentheses, their correlative inflation-adjusted prices in current dollars. The second table uses intraday highs, rather than monthly average closing prices, for those who are interested.
Table No. 1 (monthly average closing prices)
JANUARY 1980 $ 677 ($2743)
AUGUST 2011 $ 1825 ($2536)
JULY 2020 $ 1971 ($2395)
The average monthly closing price for August 2024 is $2503. The price of gold at $2503 is cheaper than August 2011 and January 1980.
Table No 2 (intraday highs)
JANUARY 1980 $ 843 ($3407)
AUGUST 2011 $ 1896 ($2634)
JULY 2020 $ 2058 ($2500)
When using intraday highs, the current gold price of $2578 is far cheaper than its 1980 ($3407) inflation-adjusted price.
CONCLUSION
A rising price for gold does not mean that the value of gold is increasing. Gold's value is in its use as money. That value remains the same as it was centuries ago. Further, the price of gold tells us nothing about gold. The higher price of gold over time is a reflection of the loss of purchasing power in the U.S. dollar; nothing more.
A higher gold price in recognition of the U.S. dollar's loss of purchasing power comes after the fact. The price peaks (1980, 2011, 2020) were not exceeded until further significant loss of purchasing power had occurred; and, in belated fashion after several years.
Even though the nominal dollar price of gold has quadrupled since January 1980, its recent closing price of $2578 is still cheaper than its 1980 inflation-adjusted price.
Any lasting, significant increases above the current gold price are unlikely in the near term unless there is a sudden and rapid acceleration of the dollar's decline in purchasing power.
*******


