Nothing Has Changed In The Past Year
For all the recent depressing price action in gold and silver, really nothing has changed in the past year. Take silver’s BEV chart as an example, below we see where in April of 2013 it was bushwhacked to its BEV -60% from its BEV -40% line in just a matter of weeks, but silver’s lows of last June have so far held. The bulls can’t seem to make silver go up, but for the past year the bears apparently can’t get silver to go down to new correction lows either – at least so far.
And you just know the big silver shorts want the price of silver to come down more. Geeze Louise look at correction E in the chart, it’s gone on for 749 trading days and is still bouncing on its bottom. Unless the US Mint decides to pass out its silver eagles for free in unlimited quantities for as long as it takes, they may not be able to force silver below its BEV -65% line.
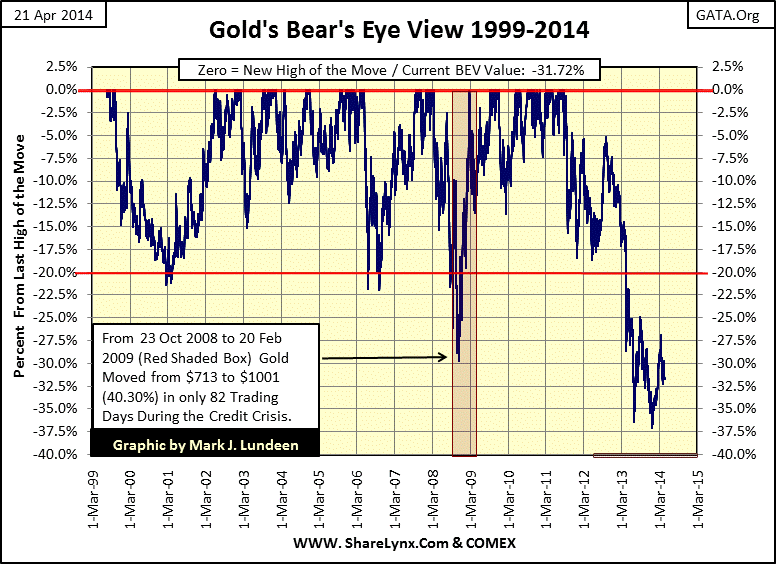
Here is gold’s BEV chart, like silver gold’s current correction is the deepest and most prolonged since the precious metals bull market began in 2001. Again the bulls can’t seem to make the price of gold rise up to new highs, but clearly the bears are having problems too. Gold in the past year, like silver, is building a great base for future price gains. Maybe it’s time for the US Mint to begin passing out its gold eagles for free too if they are really serious about forcing the price of gold below its BEV -40% line. I’m ready to take ten thousand eagles at no cost, maybe even more if that is any help to them.
The Dow Jones too is taking time to ponder what to do next. Here is a price chart for the Dow Jones showing its credit-crisis bear market with the amazing recovery since March 2009.
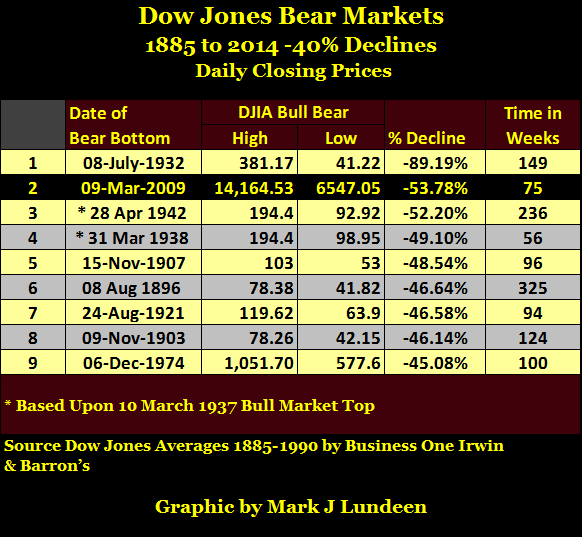
The 2007-09 Dow Jones decline was the #2 bear market bottom since 1885, a vicious 53% decline that took only 75 weeks to complete.

There is no historical precedence for having the Dow Jones advance to new all-time highs so soon after such a traumatic decline. However, currently the stock market has the advantage of having idiot savants managing “monetary policy” with the courage to “inject” as many trillions of dollars into the financial markets as it takes to achieve “market stability.” That’s the good news – the bad news is that ultimately this “stability” will not end well.
Here is the Dow Jones BEV chart beginning on 09 March 2009, the exact bottom of the bear market when most people were too traumatized to even think of buying stocks. Perversely, this was the time to sell the farm and buy the market on margin. Look at all the BEV Zeros from March 2009 to April 2010; a quick look at the Dow Jones price chart above shows a thirteen month advance of 71%. But if it wasn’t for the idiot savants at the Federal Reserve “injecting liquidity” into the rear end of the stock market bull, I suspect we would have seen the Dow Jones 70% below its October 2007 high in April 2010.
That may sound extreme, but remember the entire global banking system was upchucking on hundreds of trillions of dollars in credit-derivatives that were coming into the money because of mortgages that went bad. If the Federal Reserve didn’t monetized these mortgages and then “injected” the resulting “liquidity” back into banks, the credit-crisis bear market would have gone on to Great Depression levels. Importantly, the credit-derivative monster was never slain. When interest rates once again return to historical norms, the banks will be upchucking derivatives once again.
Taking another quick look at the two Dow Jones charts, like silver and gold, not much has changed in the past year, but it seems to me that the best is past for the stock market while the worst is now over for silver and gold. So if the Dow Jones sees more new highs, or if gold and silver ultimately go on to new correction lows they won’t prove to be significant market events. If you really believe that it’s best to sell investments when they are high, and buy them when they are low, now may be the time to sell your stocks and buy some gold and silver.


