One Last Melt-Up?
 share
share
 share
share
 share
share
 share
share
 share
share
Will there be one last melt-up before this doddering bull market seeks penance? Some of my fellow gurus believe a final show of bravado is coming, especially those who base their predictions on Elliott Wave Theory. I think the party is over, but I’m forced to admit that if too many traders agree with me, new record highs fueled by short-covering are likely. My skepticism is based more on market psychology than on the charts displayed above. We’ll get to them in a moment, but first let’s consider investors’ state of mind, based on what people we know have been saying.
Stocks came down hard in the last month — hard enough for the usually thundering herd to wonder whether it might be time to bail out, or at least lighten up and move into cash. It was not quite a bloodfest, but the megastocks that made 2024 a year to brag about have been hit especially hard. When last week began, the broad averages had given up all of their Trump 2.0 gains and then some. But just when it seemed like stocks were about to go over the cliff, the S&Ps uncorked a 100-point rally on Friday, saving not only the day, but the week.
Come Monday, fear will have turned into nervous hope. I expect Mr Market to encourage this self-deception with more of the same. If Friday’s surge was the start of a bear rally worthy of the name, we should look for it to continue until nervous hope turns into greed. That would imply a run at the old highs.
A Different Kind of Dip
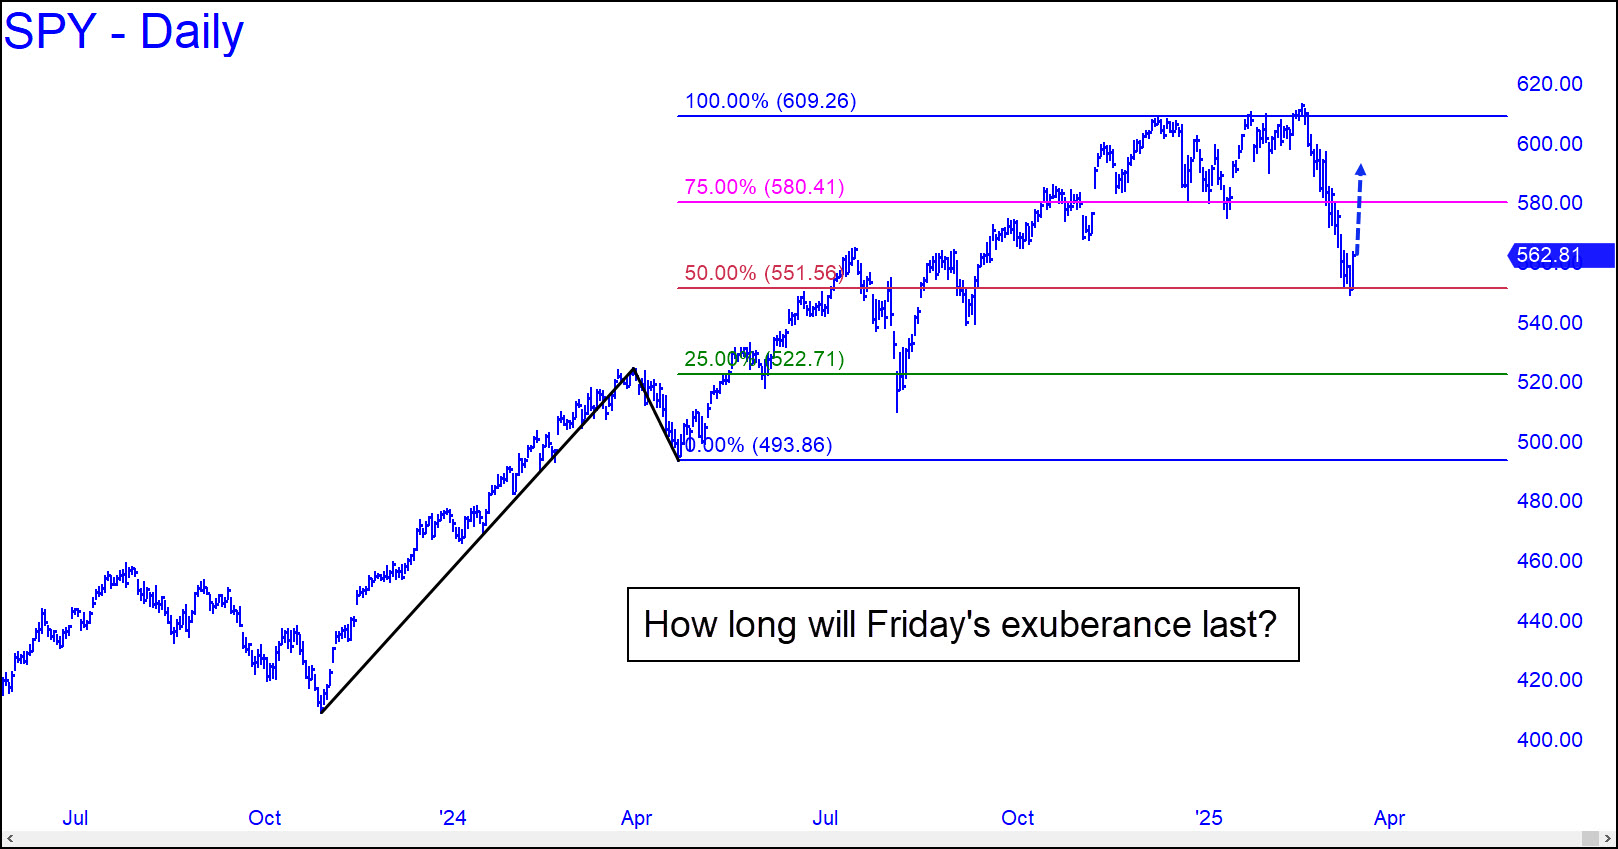
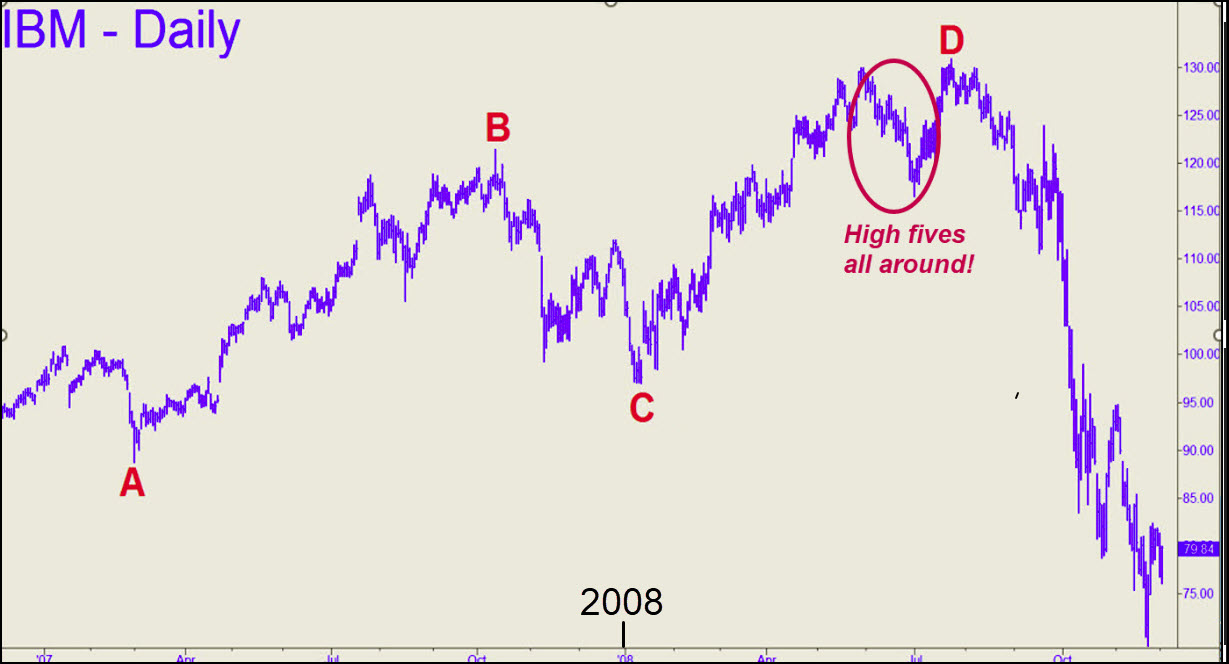
The similarities between the charts are too striking to dismiss, as is the implication that the Mother of All Tops is already in. As summer began in 2008, IBM came within an inch of a Hidden Pivot ‘D’ target, then fell sharply. I was too busy patting myself on the back to notice as it clawed its way back toward a marginal new high that actually touched my target. More recently, the S&P 500 ETF, which goes by the symbol SPY, came within a hair of a 609.26 target I’d identified six months earlier. SPY then scuddled sideways for ten weeks, eventually poking slightly above the earlier high. This false breakout surprised enough bulls that they have been unloading stocks for the last month. But the selling has been met with persistent bids, presumably by bulls who have not seen a dip fail to recover quickly since the bear market of 2007-09.
The charts differ mainly in the way I’ve truncated their respective A-B rallies, but the targets are equally valid. The IBM chart shows the devastation that can occur when literally everyone is on board at the top. In this case, the herd was joined by short-covering bears who threw in the towel when Big Blue pushed above the old high near $130. If SPY is about to replicate IBM’s swan song, the bounce that began on Friday should eventually bring it up to around 581, halfway to the top. We’ll be monitoring every feint, thrust and dive closely the whole way up, so stick around if you want to stay apprised.
********
share
share
share
share
share