Reasons For Not Liking The Stock Market In 2014
The Federal Reserve has let it be known that it intends to reduce its purchases of mortgage and US Treasury debt (taper its Quantitative Easing) to zero. At each of the Federal Reserve’s past two meetings they’ve cut their QE purchases by ten billion a month. They hope to be finished with this program of mindless monetization by this autumn. However, I expect that the cheap-credit junkies in the financial markets will be suffering from withdrawal symptoms long before then. One thing stock-market bulls need to keep in mind is that the Dow Jones’ current bull-run began on 09 March 2009, and historically, five years is a long time for the Dow Jones to increase by 150% without a major correction.
But the Dow Jones Industrial Average is only 30 major blue-chip stocks while the stock market itself consists of thousands of publicly traded companies. A better way to understand the internal performance of the stock market is by looking at the Dow Jones Total Market Groups (DJTMG) and examining how many of these groups are within 20% of their all-time highs. Keep in mind this data is dynamic; all-time highs don’t last long in bull markets.
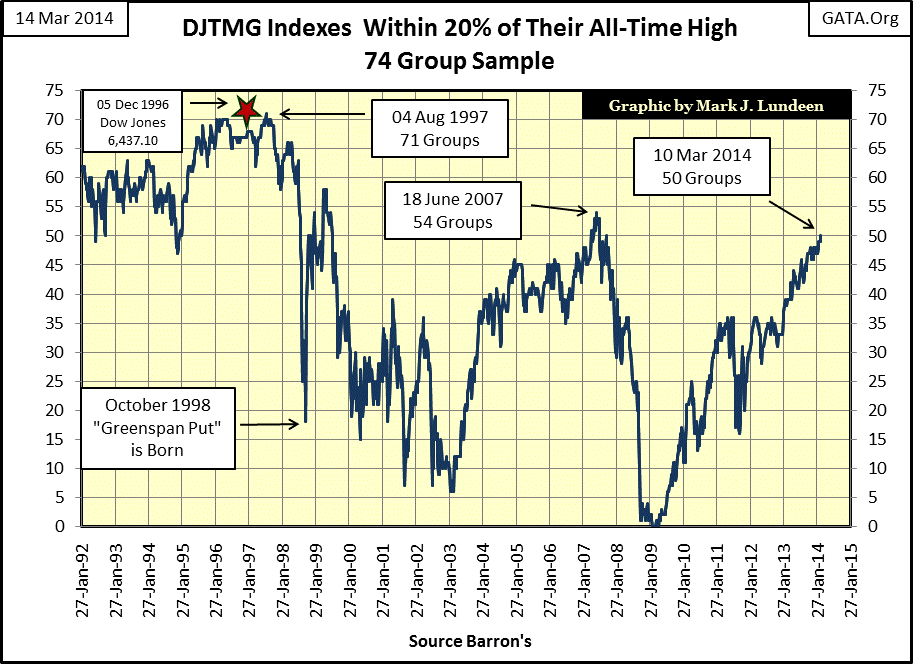
Twenty two years ago in Barron’s 02 January 1992 issue the Dow Jones was at a new all-time high (3,172.41), with 62 of the 74 DJTMGs I follow within 20% of theirs (see chart below). In fact, 40 of the groups were less than 5% from a new all-time high with seven of those at a new all-time high. The early 1990s was a time when making money in the stock market was easy as every company’s shares seemed to only to go up in price. In the chart below I placed a red star at 05 December 1996, the day Alan Greenspan gave his “irrational exuberance” speech. Five years later with the Dow Jones at 6437 and 102% higher than in January 1992, and 728% higher than when the bull market began in August 1982, Alan Greenspan asked the American Enterprise Institute:
“But how do we know when irrational exuberance has unduly escalated asset values?”
- Alan Greenspan’s, 05 December 1996 Speech on Irrational Exuberance in the stock market
Greenspan understood exactly what was happening; he was inflating a bubble in the stock market. That’s why he blamed the inflating valuations on the market’s irrational exuberance and not his own “monetary policy” as 64 of the 74 DJTMG’s were within 20% of their all-time high. But by December 1996 it was even worse than that; at the time of his speech 24 groups were at all-time highs, and another 27 groups within 1% of their all-time high. The market’s exuberance became even more irrational nine months later. By the 04 August 1997 issue of Barron’s, the DJTMG had hit its peak with 71 of 74 groups within 20% of their all-time highs, with 36 of the groups at new all-time highs and 26 groups within 1% from one. This made August 1997 the top for the DJTMGs as a whole. After August 1997, making money in the stock market was never as easy as it had been before, as one now had to be in the right groups. Many stock sectors began their bear market more than two years before the Dow Jones peaked with its high-tech bubble top in January 2000.
We can also see the birth of the “Greenspan Put” in this chart. Barron’s 12 October 1998 issue saw only 18 of the DJTMGs within 20% of new all-time highs, with only one group (Tobacco) at a new all-time high. This was quite a fall in such a short time; investors were near panic. One week and a “Greenspan Put” later, 39 of the DJTMGs were within 20% of making a new all-time high. But with or without the “Greenspan Put,” the end of the 1982-2000 bull market was approaching. As the Dow Jones continued making new all-time highs during 1999, the majority of stock groups in the DJTMG had already begun their bear market, well before the Dow Jones finally did in January 2000.
The sub-prime mortgage bubble’s effect on the stock market can also easily be seen above. From a low of six in February 2003, the DJTMG saw 54 of its groups increase to within 20% of an all-time high in Barron’s 18 June 2007 issue. And remember, this data is dynamic; these new all-time highs are not the same all-time highs from the 1990s. The mortgage-stock market bubble’s in the DJTMG was more selective than was the high-tech bubble of August 1997; high-tech and mobile phone stocks were not invited to the party. And unlike the leisurely two year decline in the DJTMG’s 20% plot from its peak in August 1997 to the Dow Jones peak in January 2000, when the DJTMGs began their decline in 2007, so did the Dow Jones just a few months later in October 2007 with disaster striking within a year.
Here’s a table giving the specifics. The left side lists the Barron’s issue for the DJTMG’s 20% peak, with the corresponding valuation of the Dow Jones. The right side lists the peak in the Dow Jones, along with the number of DJTMG’s within 20% of their all-time high. There was a huge difference between the high-tech and the mortgage bubbles because of how “liquidity” flowed into them from the Federal Reserve. During the 1990s “liquidity” flowed from the banking system directly into the stock market. During the 2000s “liquidity” was first diverted into the housing market via inflated mortgages that were destined to go bad – quickly. Then when the mortgage market tanked, it took the stock market down with it along with the banking system.
Seventeen months after the Dow Jones’ October 2007 top, the Dow Jones found itself at the second deepest bear market bottom since 1885; a vicious 75 week 53.78% decline from its October 2007 bull market high.
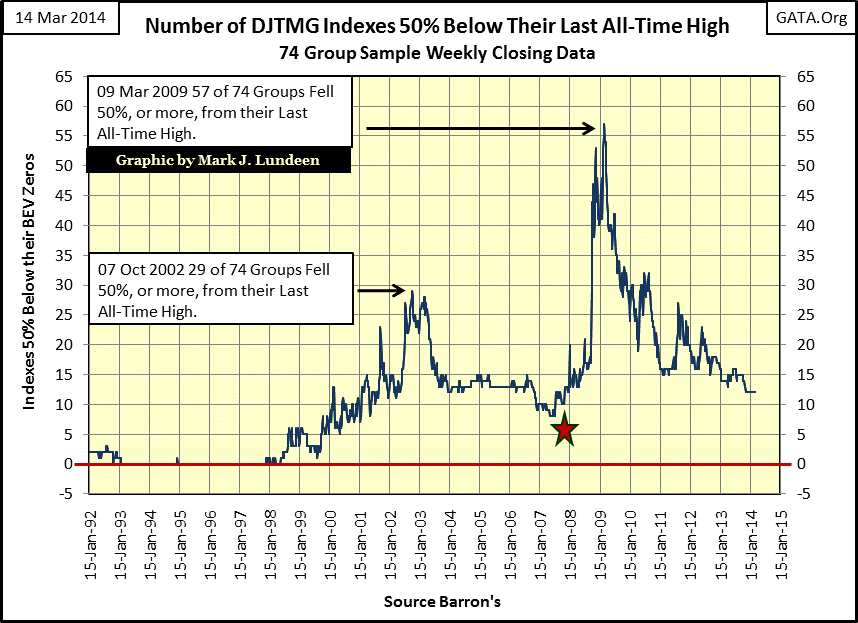
The decline of March 2009 would have been much deeper had the US Government not decided to bail out the banks with trillions of dollars of monetary inflation, something they continue to do to this day with their QE program. However the best laid plans of mice and our monetary authorities seldom end as planned. With 50 of the DJTMG indexes currently within 20% of an all-time high (chart above), and the Federal Reserve continuing to taper its QE, we may be approaching the time when the stock market once again begins to decline. How bad could the decline be? Potentially disastrous as shown in my next chart plotting how many of the DJTMGs have declined 50% or more from their all-time highs.
From 1993 to 1998 50% declines in the DJTMGs didn’t happen. But as the January 2000 Dow Jones top approached they began to occur. During the 2000-2002 tech-wreck bear market, when the Dow Jones itself ultimately declined by 38% in October 2002, 29 of the 74 DJTMG groups suffered declines greater than 50%. Some of these groups never recovered. Even when the Dow Jones peaked at 14,164 in October 2007 (see Red Star below), auto manufacturing and the hot high-tech stock groups of the 1990s were still 50% or more below their 1990s’ highs.
In Barron’s 09 March 2009 issue which covered the Dow Jones’ credit crisis bottom we find 54 of 74 DJTMGs 50% below their last all-time high, but 35 of those indexes were 65% below their last all-time high, with 21 of those 75% below, and 4 groups were 90% below their last all-time high. The Dow Jones’ decline of 54% in March 2009 doesn’t really convey the horror of Mr Bear cleaning up the mess of Washington’s mortgage debacle, a task that Mr Bear has yet to finish.
In fact, the piles of financial garbage Mr Bear intends to transport to the dumpster in 2014 are significantly higher than they were in 2007 thanks to Doctor Bernanke and now Janet Yellen. Dollars today are created only when someone takes on debt from the banking system. The Federal Reserve may be “injecting” tens of billions of new dollars into the banking system each month, but the flip side of this coin is that the economy is also creating at least that much new debt burden somewhere else, while destroying the value of savings, and the incentive to save. Wall Street is doing its part to “revive” the economy with current subsidized low interest rates. Corporate America has seen a binge in corporate bond issues, but most of the money from this increase in debt isn’t going into profitable enterprise but rather to fund share buyback programs and dividend payouts. But Mr Bear won’t allow this foolishness to go on forever. When the debt cycle reverses, corporations who now take on debt to fund dividend payouts will quickly cut their dividends to service their debt and that will have a huge impact on share valuations.
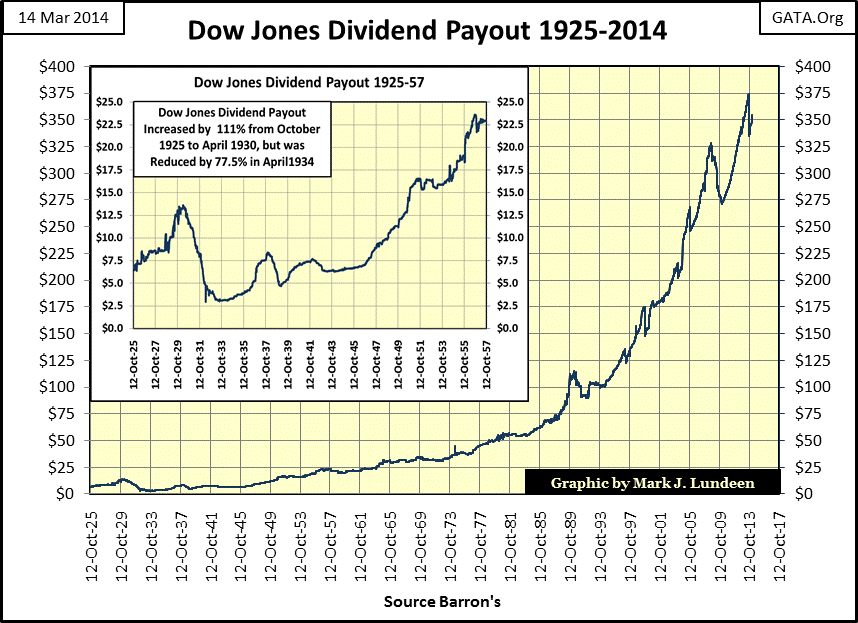
There are two ways to value the stock market; how the bulls do it and how Mr Bear fixes share prices. The bulls don’t give a damn about dividend yields, not during bull markets when single digit dividend yields are exceeded by double digit capital gains. But there are limits to how high stock valuations can go, or at least there were limits before Alan Greenspan became Chairman of the Fed. In the chart below, from 1925 up until 1987, a 3% Dow Jones’ dividend yield was a dependable and time tested market signal that the party was over for the bulls, and would continue to be until the Dow Jones’ dividend yield once again exceeded 6%.
But that all changed when Alan Greenspan became Fed Chairman, and he knew what he was doing. As noted in the text box at the upper right corner of the chart, Greenspan gave his Irrational Exuberance speech in December 1996; a month later the Dow Jones dividend yield sank below 2% for the first time in history and didn’t bottom until the Dow Jones was yielding a mere 1.32% in January 2000, at the top of the high-tech bubble.
Mr Bear on the other hand, values share prices by dividend yields. During bear markets, capital gains become only pleasant memories of times gone by, and dividends a daily reality. Valuing share prices according to dividends is an easy mathematical exercise; divide the stock’s dividend payout by its dividend yield returns the share price in bull or bear market, but it’s during bear markets that dividends become an issue. It certainly was in March 2009 when the Dow Jones dividend yield increased to merely 4.68%, driving the Dow Jones valuation down 53% from its October 2007 bull market high. At the time CNBC had many “market experts” recommending stocks based on their strong dividends, as from October 2008 to the summer of 2009 it was pointless recommending investment in stocks based on capital gains to shell shocked investors. Five years later with the Dow Jones up 150% from March 2009, dividends have once again become a non-issue.
I find it amazing that in March 2009 the Dow Jones found itself in its second deepest decline since 1885 with a dividend yield of less than 5% (see dividend yield chart above). The low dividend yields of the past two decades are a historical anomaly, proof of official bias for higher valuations in the stock market. When Mr Bear comes back to work to remove decades of toxic assets from the world’s balance sheets, we can count on dividend yields increasing along with bond yields to levels few people today would believe are possible. So how will that impact valuations in the stock market?
Here is a table listing possible Dow Jones valuation at various yields and payouts. Note that rising yields or falling payouts are bad for share prices. Currently the Dow Jones is paying out $355.30 and yielding 2.21% (2.2115% to be precise). Divide $355.30 by .022115 and you’ll come up with the Dow Jones Friday’s closing price of 16,065.67. Let’s look at the table’s dividend payout of $350, which is close to the Dow Jones’ current $355.30 payout. Pricing the Dow Jones as Mr Bear does, for example with a dividend yield of 2.00% and the Dow Jones valuation increases to 17,500, but if the dividend yield increases to 6.00% the Dow Jones crumbles to 5833; that’s a decline of 64% from today’s closing price. With the Dow Jones down 64%, many of the groups in the DJTMG will do much worse than in March 2009.
But during the really bad bear markets, dividend payouts decline as yields increase. During the Great Depression bear market the Dow’s dividend payout declined 77% as it yield increased to over 10%. People committed suicide as this resulted in an 89% decline in the Dow Jones. What would happen if the Dow Jones dividend payout was cut by 43%, down to $200 yielding 6.00%? Such a decline in payouts and a 6% yield are well within historical norms and would take the Dow Jones down to 3,333 for an 80% decline from the Dow Jones’ last all-time high. Is this possible? Yes it is, and I suspect a constant fear of more than a few members of the Federal Reserve’s Open Market Committee who know there will be consequences for what they have done.
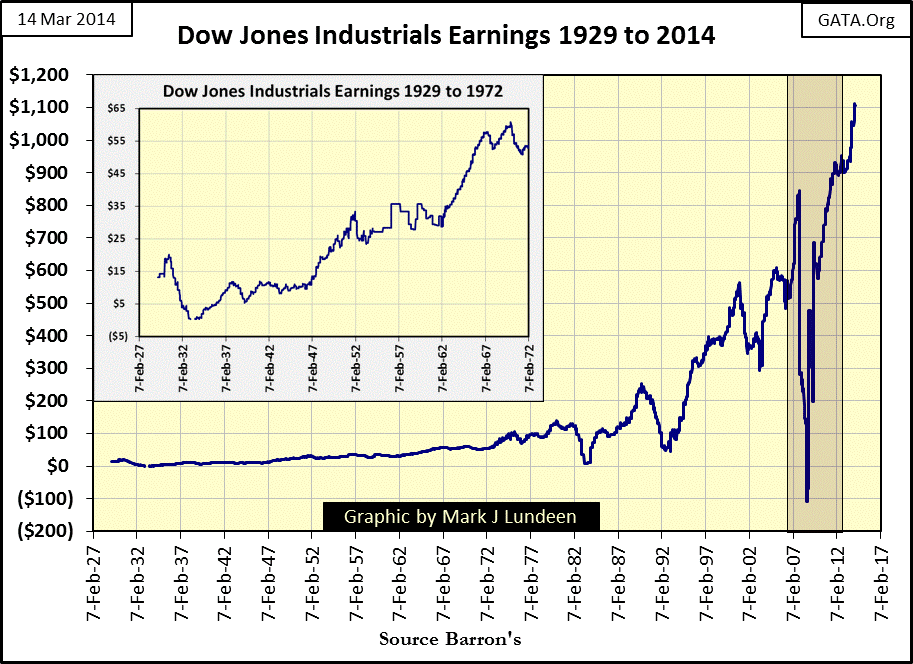
Dividend payouts also declined during the mortgage debacle bear market, but the chart shows that since 2009 they once again have increased; but like the Dow Jones earnings in the chart below, we have to wonder how in our current economy. Geeze Louise, just look at what happened during the credit crisis; the Dow Jones earnings fell from $844 in November 2007 to -$109 in August 2008, a nine month earnings decline of $953. But the really scary thing is what happened after; the Dow’s earnings came back almost as fast as they went away. Since 1929 such a thing had never happened before. After the collapse of earnings during the depression, the Dow Jones didn’t again see its earnings above $20 until 1949. How the hell did the Dow Jones’ earnings go on to new all-time highs so quickly after August 2008? Simple; America’s financial markets are regulated by Washington DC and Washington wants the voters’ investments in a bull market and they aren’t afraid to bend the rules to make this happen. But like today’s government statistics, current stock earnings just aren’t real so the good times won’t last. In fact, when reality once again intrudes on the public’s perception of market valuations – and risks, current conditions are perfect for a historic market crash.
For reasons of financial hygiene, Mr Bear isn’t a popular guy with the investing public, or Wall Street bankers and Washington’s politicians; not that he cares. All Mr Bear cares about is that financial assets held in public and private balance sheets are viable and properly valued; if not, he goes to work on Wall Street cleaning up the financial garbage. But Washington and Wall Street interrupted Mr Bear’s cleaning crew in March 2009, and made an even bigger mess in the financial markets since then.
With Washington tapering their QE program, making waves over the Crimea, and China’s debt markets and banking system on the threshold of something really bad, a black-swan event could easily erupt out of the blue that would leave the market’s regulators helpless in maintaining current market valuations. In the past, there have been times when exiting the stock market and waiting a full decade before returning proved to be the right thing to do. That may be the best thing to do in our current market, or at least stay away until the Dow Jones Dividend yield is well above 6%, or maybe even 9%. In the meantime, gold and silver should be in a major bull market as bond yields rise and the US dollar falls, as they did during the 1970s.


