Retrospect: A Look Over The Last Year And How Well Chartology Played Out In The PM Complex


Almost exactly one year ago, on March 2, 2024, we had been following many charts for the PM complex, which were at critical inflection points and could have broken either way. Many of the chart patterns we had been following for six months or longer, waiting for a resolution, to see if critical support was going to hold.
Reality is the only thing that matters when it comes to trading the markets, which is why you always have the history of each trade, from the initial buy point to the sell.
Tonight, we are going to look at the before and after charts for the PM complex, as we saw them on March 2, 2024, and today, March 9, 2025. You can judge for yourself if the Chartology was presenting us with an accurate picture back on March 2, 2024, of what was to come over the next year.
This is how I started the “Markets Update” on March 2, 2024.
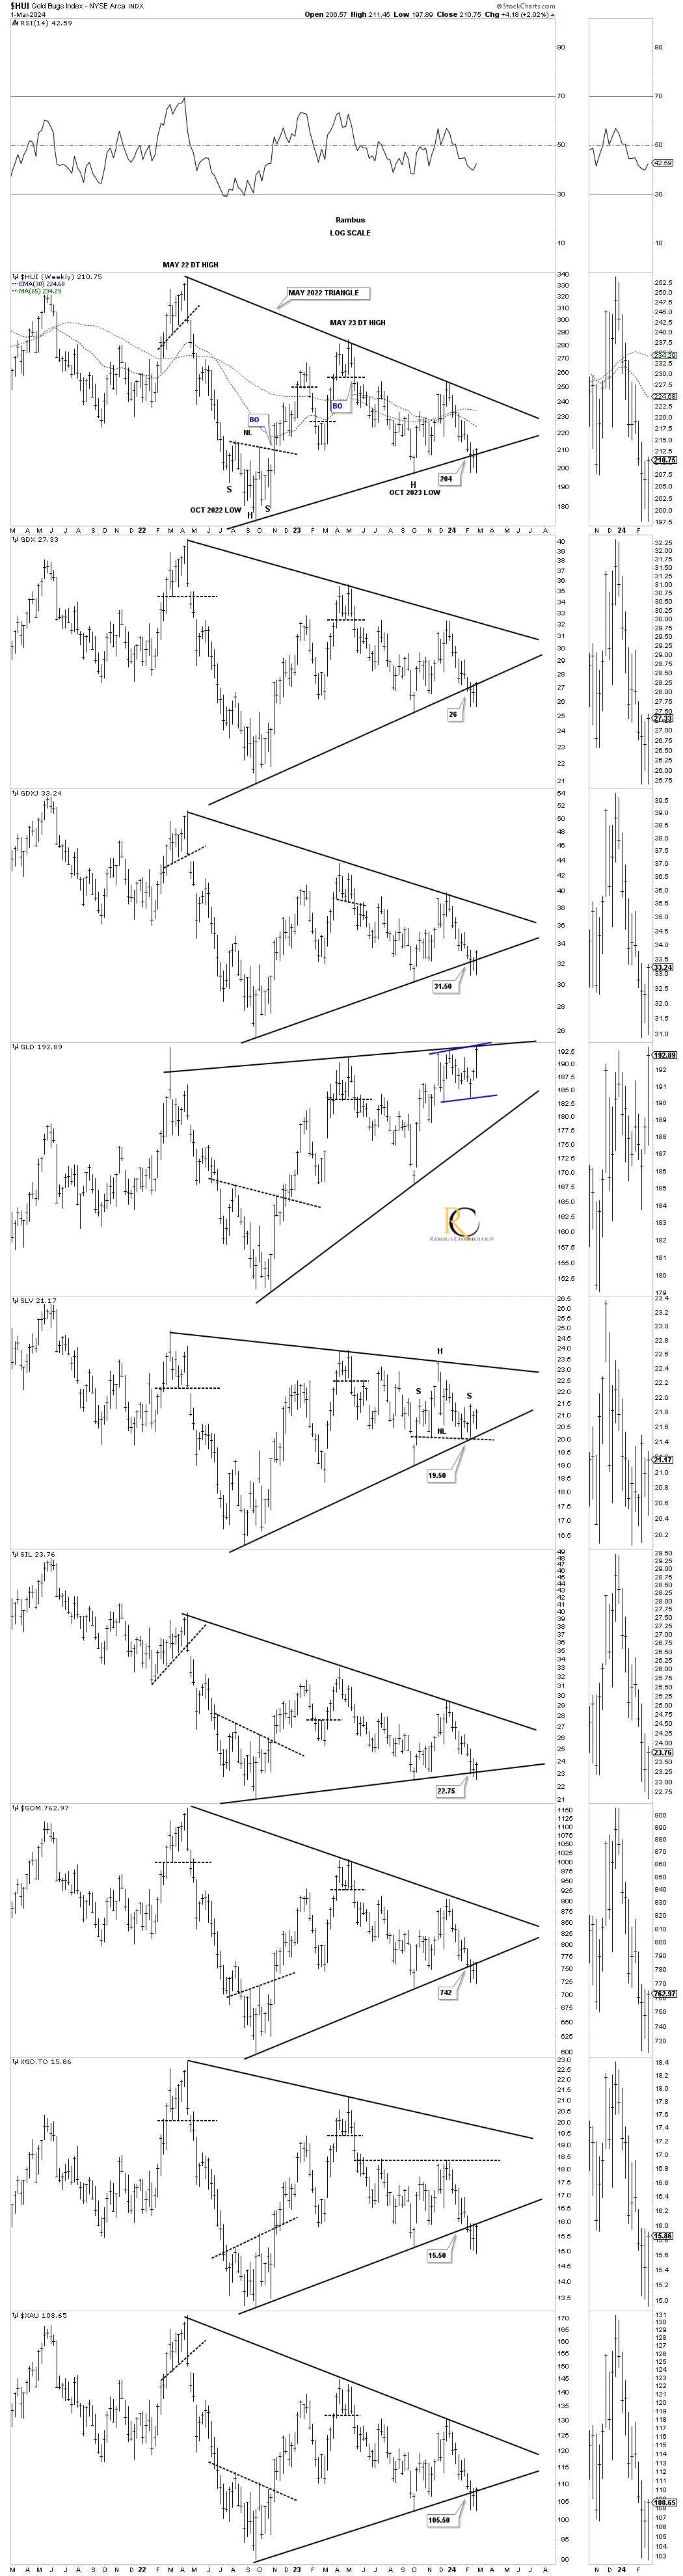
We have a bunch of charts to look at tonight, so let’s get started. Most of the charts you should already be familiar with, so I’ll go through them fairly quickly.
In many cases, the price action broke below the bottom rail of the May 2022 triangle three weeks ago and is backtesting the bottom trendline this week. This is a very important backtest taking place right now. If the price action stalls out right here and reverses back down, then the breakout will be more pronounced. On the other hand, if we see strength early next week and the price action trades back inside of the triangle, then we could be seeing a false breakout/bear trap. If it’s a bear trap, the price action can reverse direction very fast to the upside. Note GLD, which closed right on the top rail of its possible bullish rising wedge.
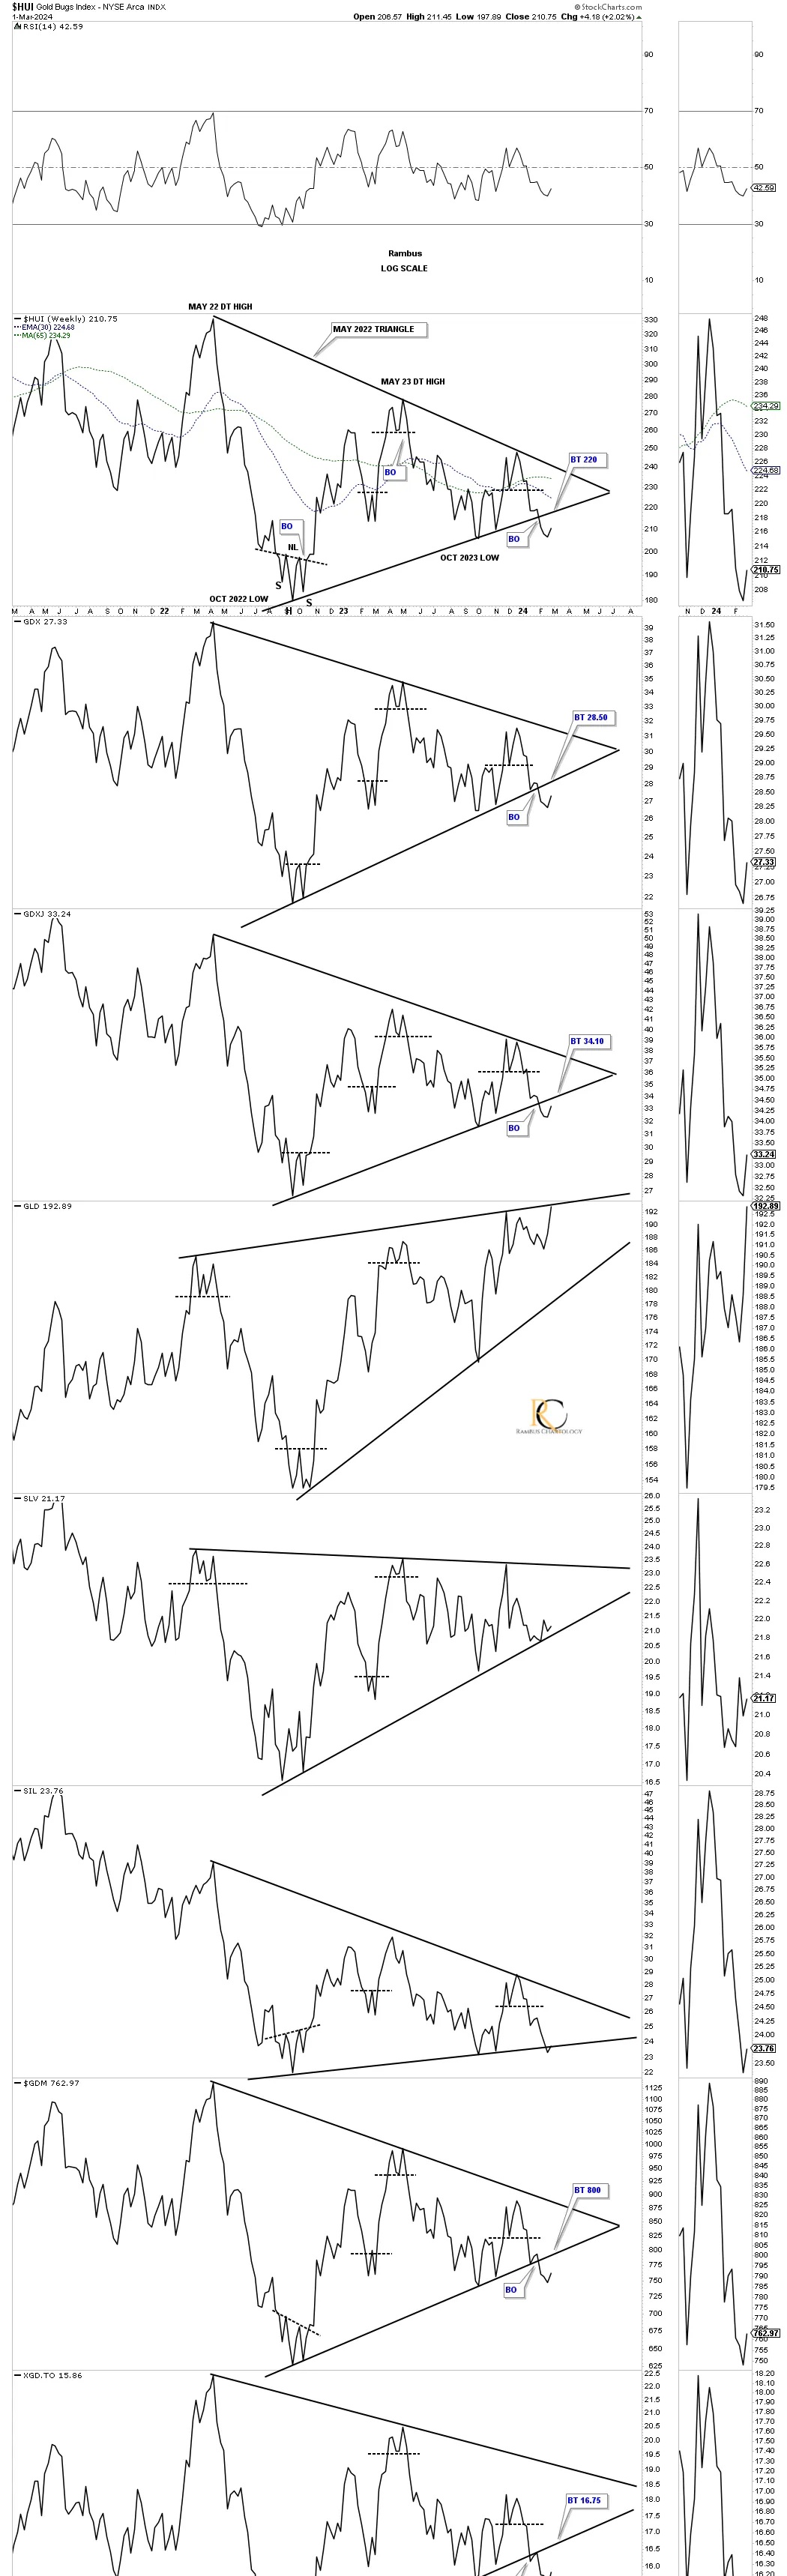
Today, March 9, 2025:
The March low, which produced the false breakout/bear trap, also formed a small double-bottom reversal pattern. We were initially looking at the blue bullish falling wedge as the halfway pattern which is still possible vs the triangle which is still forming.

March 2nd 2024:
This weekly line charts shows a larger backtest is possible before we get the final answer on whether we see a false breakout / bear trap.
Rambus Chartology is a reader-supported publication. To receive new posts and support my work, consider becoming a free or paid subscriber.
Today, March 9, 2025:
Below is the updated weekly line chart for the one above, which shows the false breakout below the bottom rail of the 2022 triangle consolidation pattern and the first leg up out of that March 2024 low to the October 2024 high. After the October 2024 high was reached, it was time to consolidate those gains, which is still ongoing. You can see many double-bottom reversal patterns that formed at the recent correction low.
The SIL has formed the blue bull flag, which now looks complete with the breakout and backtest. SILJ is still working on its small head-and-shoulders (H&S) bottom at the low end of its trading range.
For the time being, you can think of the blue downtrend line as a support and resistance line, bullish above and bearish below.

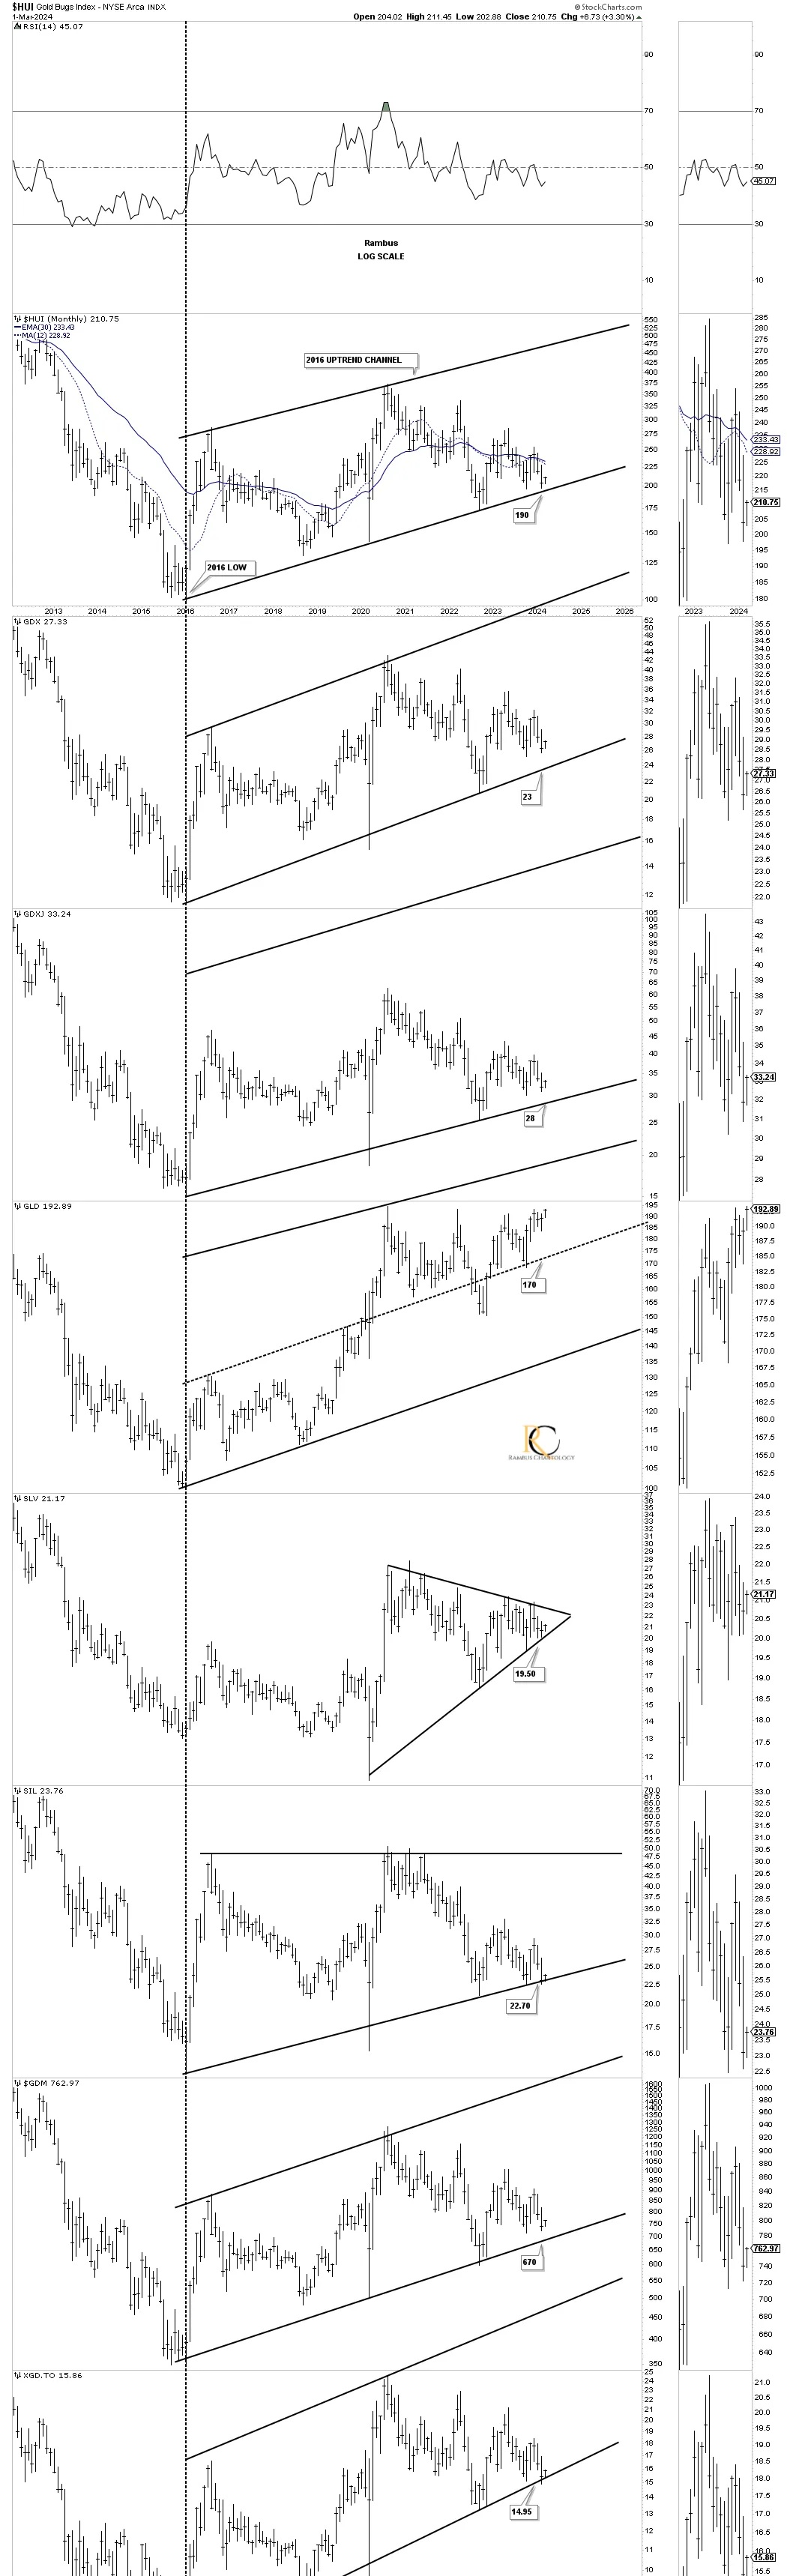
March 2, 2024:
Still the most important chart for the PM stock indexes is this 2016 uptrend channel with the bottom rail still holding support.
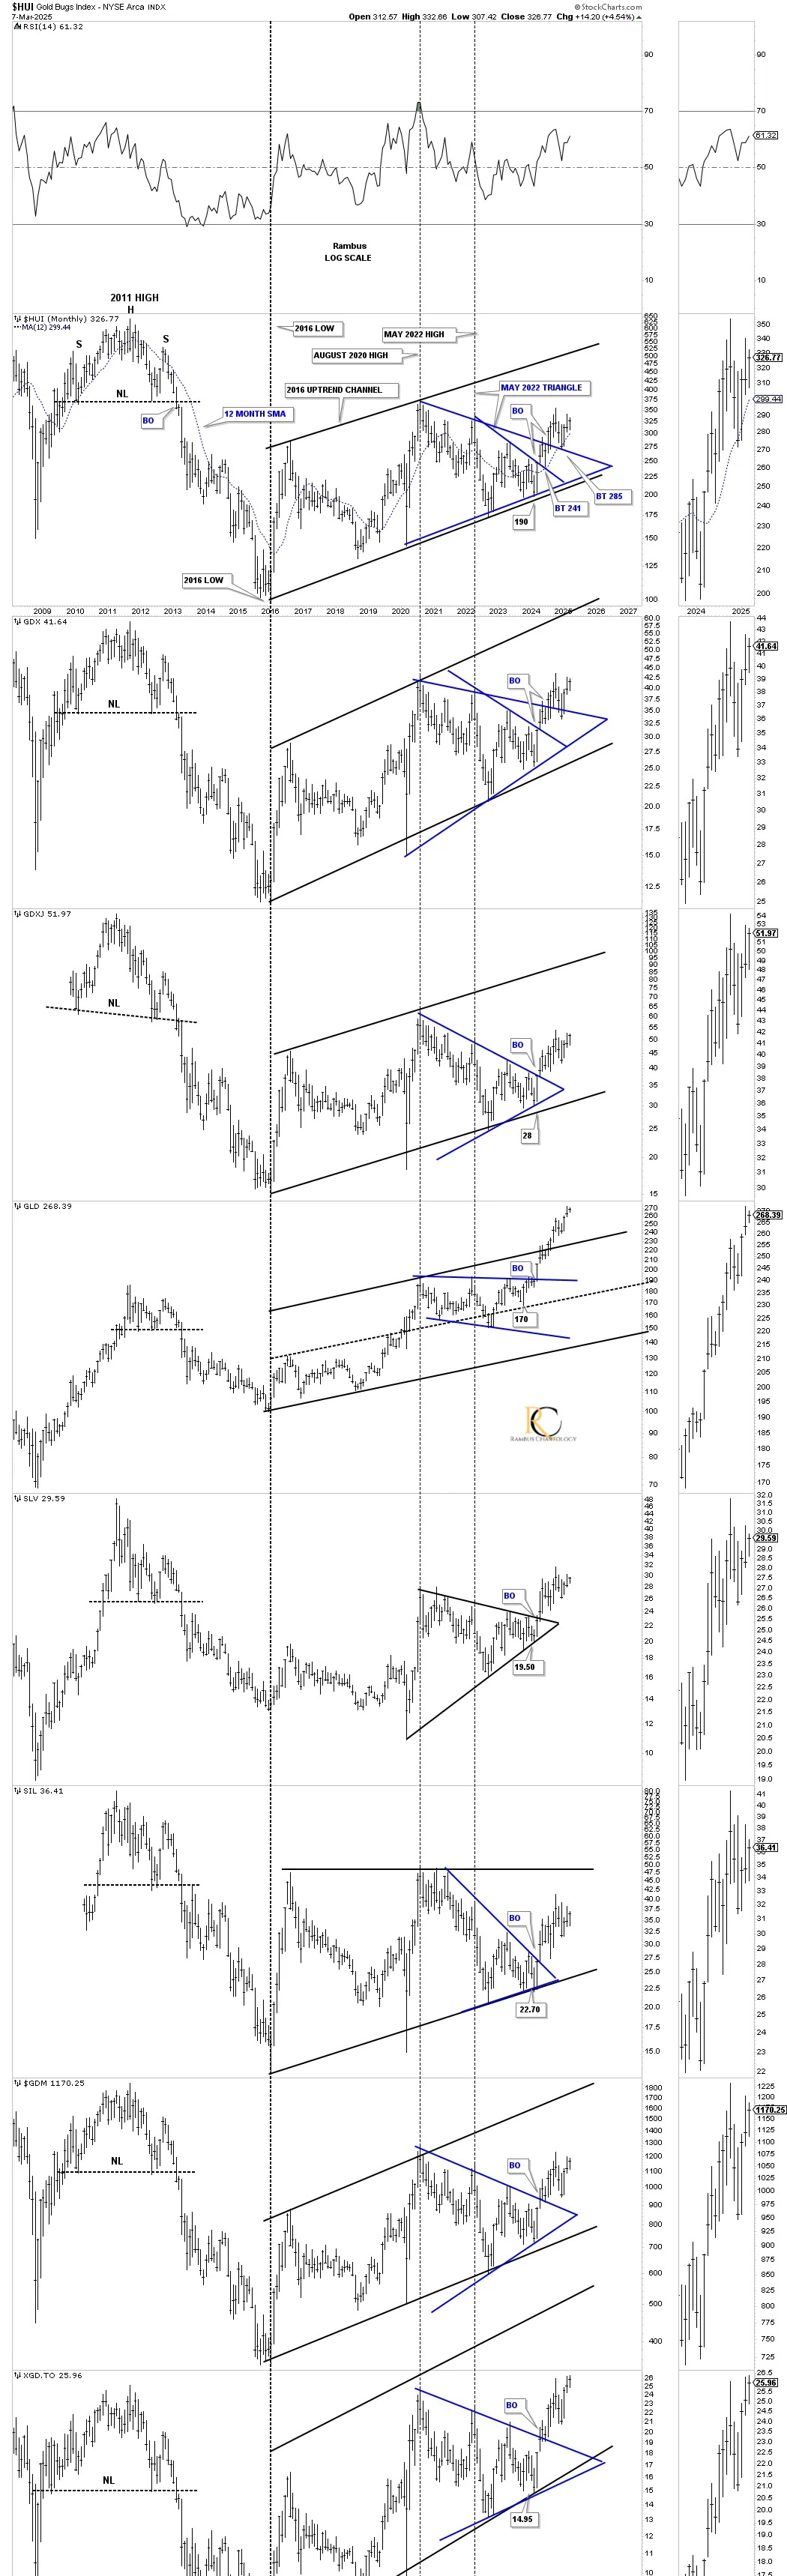
Today, March 9, 2025:
Below is the original 2016 uptrend channel, as shown on the monthly chart above, but I’ve updated it to show the 2011 very symmetrical head-and-shoulders (H&S) top. The black numbers on the chart above and on this updated chart show where we were looking for support to hold on the bottom rail of the 2016 uptrend channel. I’ve also added the blue 2022 triangles we looked at earlier to show you how they fit into the bigger picture.
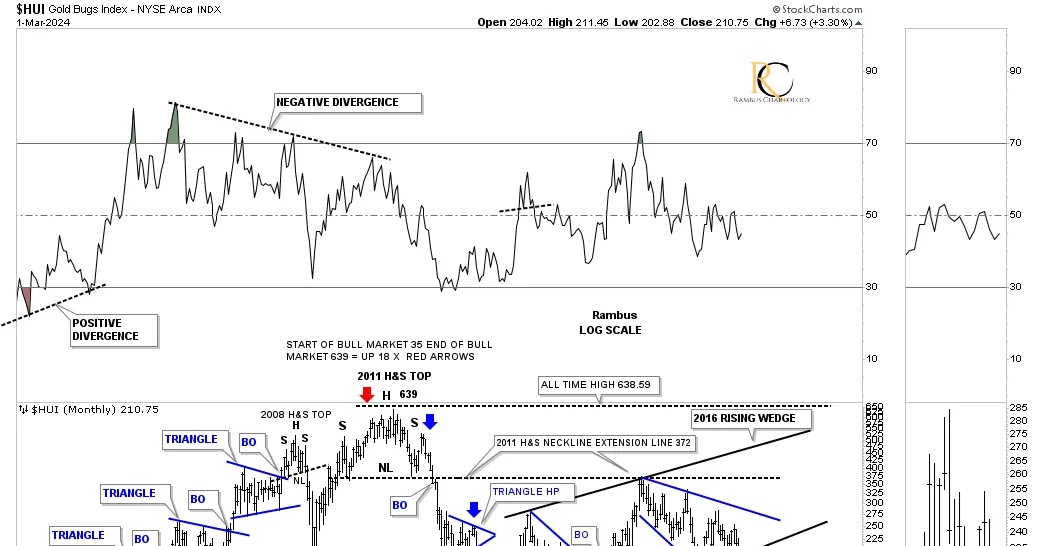
March 2, 2024:
Below is the history chart for the HUI, which shows the 2016 rising channel. Note how today’s monthly bar, for the first day of March, looks from the monthly perspective. Just the thickness of the trendline can be 5 to 10 points from this long-term view. We still have the whole month of March’s trading to go, but today’s start of the month looks encouraging. The initial bounce is coming where we were looking for it to occur.
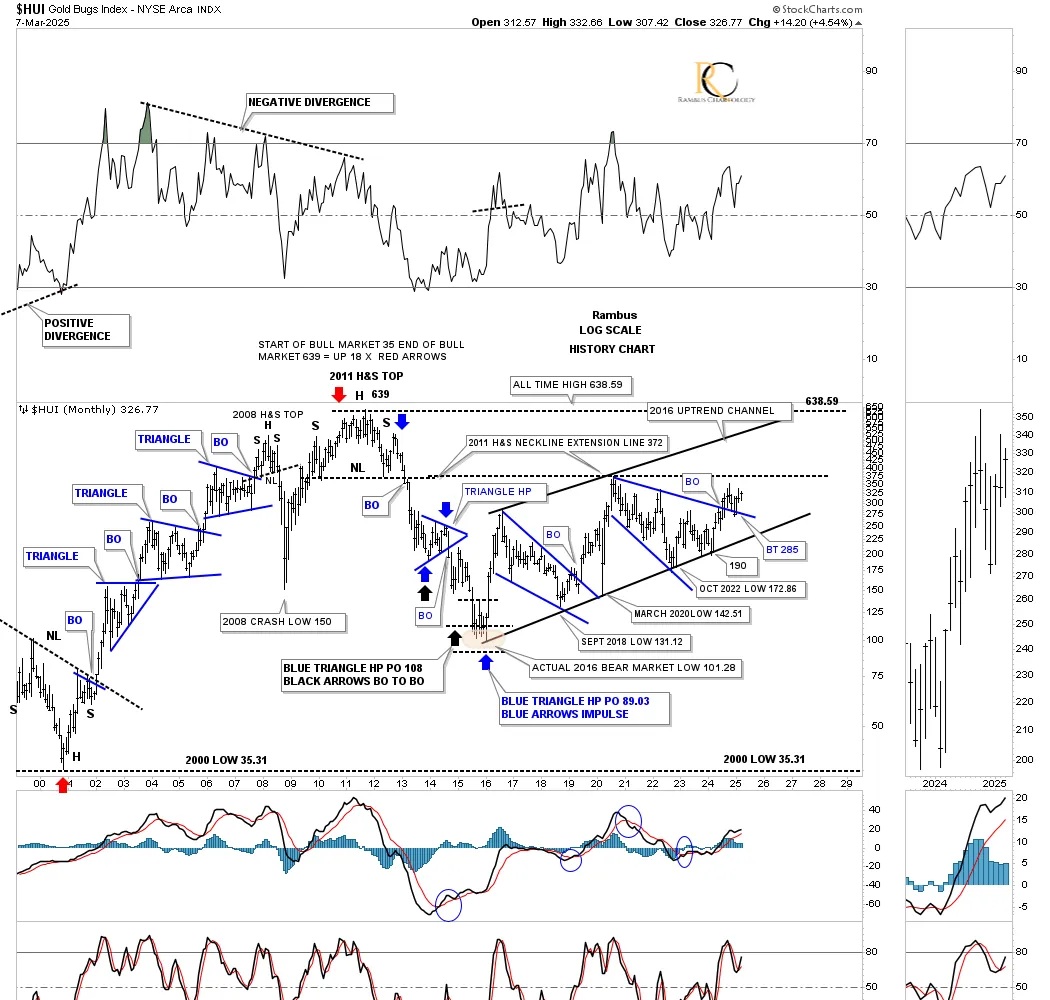
Today, March 9, 2025:
On March 2, 2024, the monthly history chart above for the HUI was testing the bottom rail of its 2016 uptrend channel at 190, with a long way to go to reach the top rail of its 2020 bullish expanding falling wedge.
This current monthly history chart shows the 190 area held support, with the breakout and backtest of the 2020 bullish expanding falling wedge looking complete. The old neckline extension line should be the next area of overhead resistance, but because it’s been basically tested twice before, the resistance shouldn’t be strong.
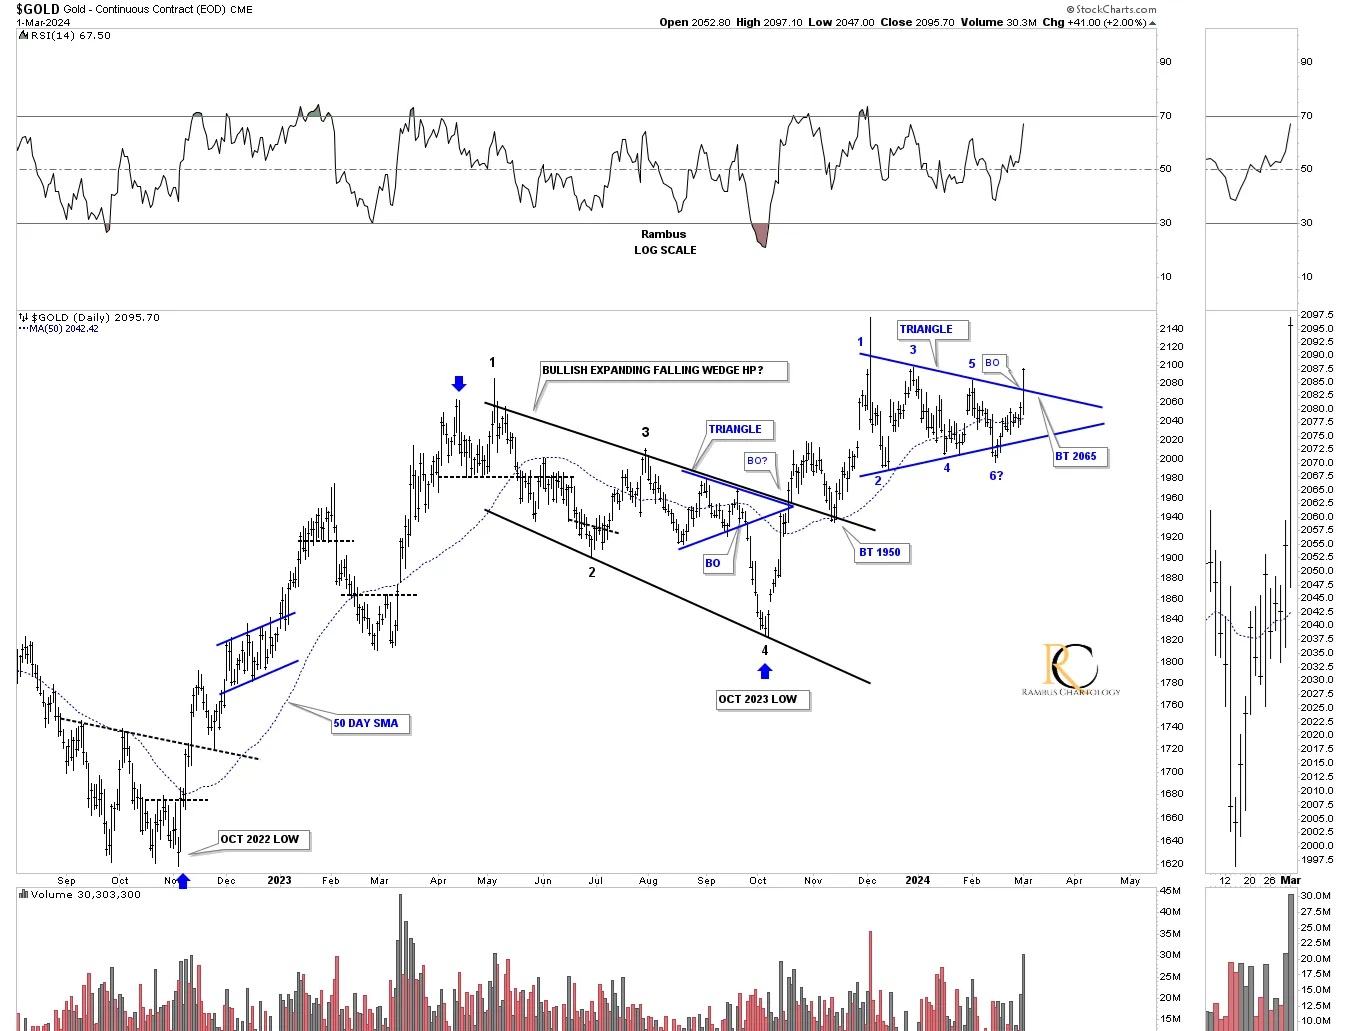
March 2, 2024:
Today, gold broke out from the blue triangle we’ve been following very closely. This was a classic breakout with a nice long daily bar on a big increase in volume. Just what the doctor ordered.
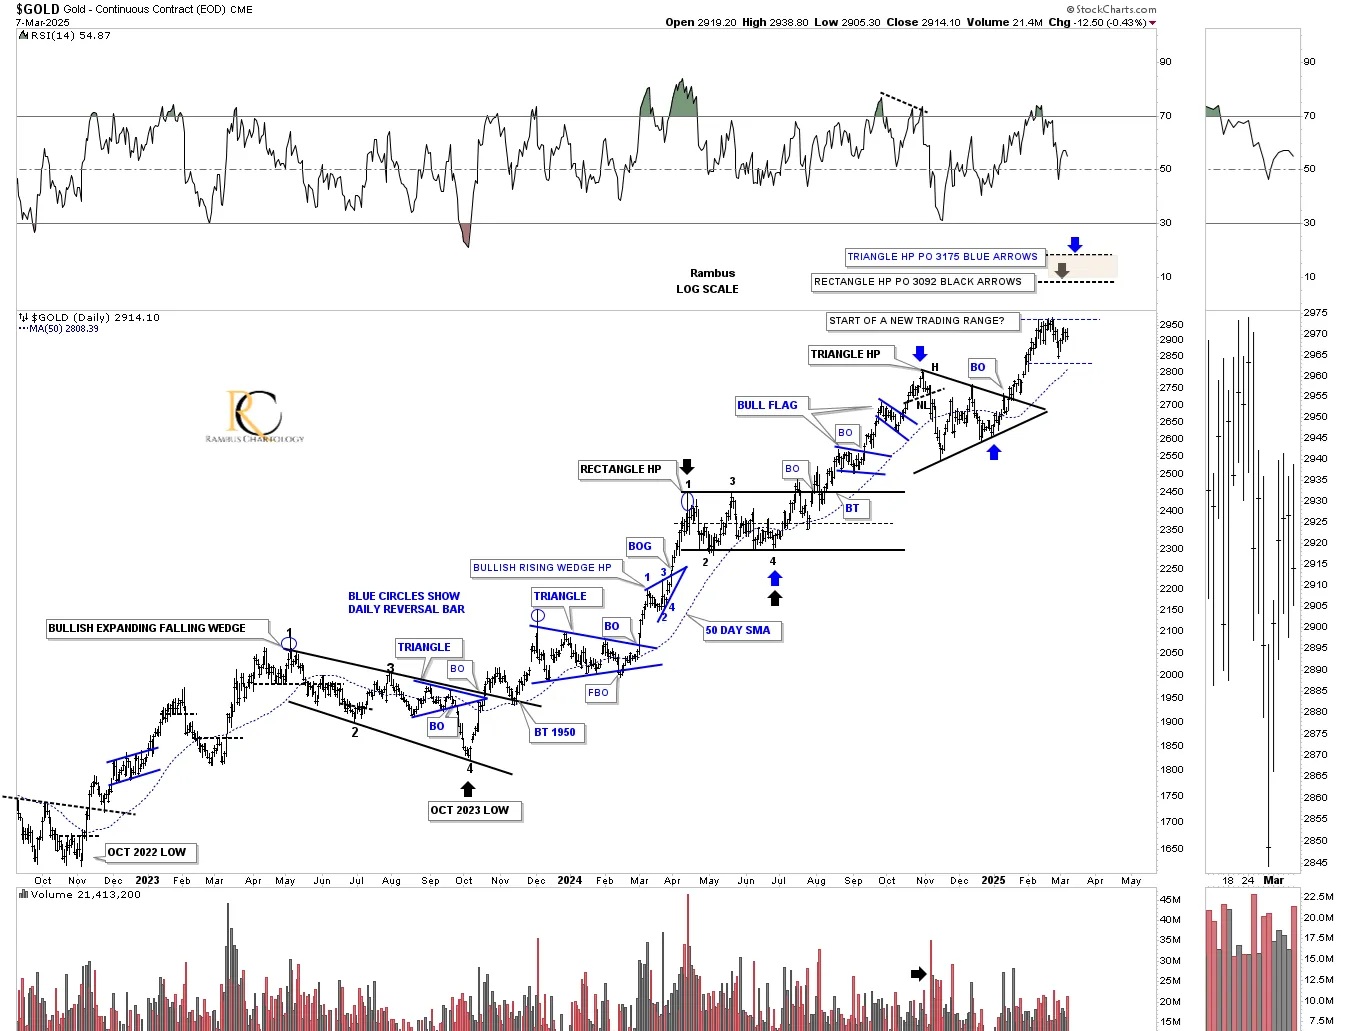
Today, March 9, 2025:
When gold broke out from the blue triangle on the daily chart above, just above the bullish expanding falling wedge, your classic bull market continued higher, with one consolidation pattern forming on top of the previous one. It’s impossible to know every possible twist and turn the price action will take in a strong impulse, but knowing it’s a strong impulse, you can look for one consolidation pattern to form above the previous one until a reversal pattern is formed. So far, there is no sign of a reversal pattern being formed.
March 2, 2024:
This weekly chart below shows how the daily chart above fits into the 2020 trading range starting at the October 2022 low.
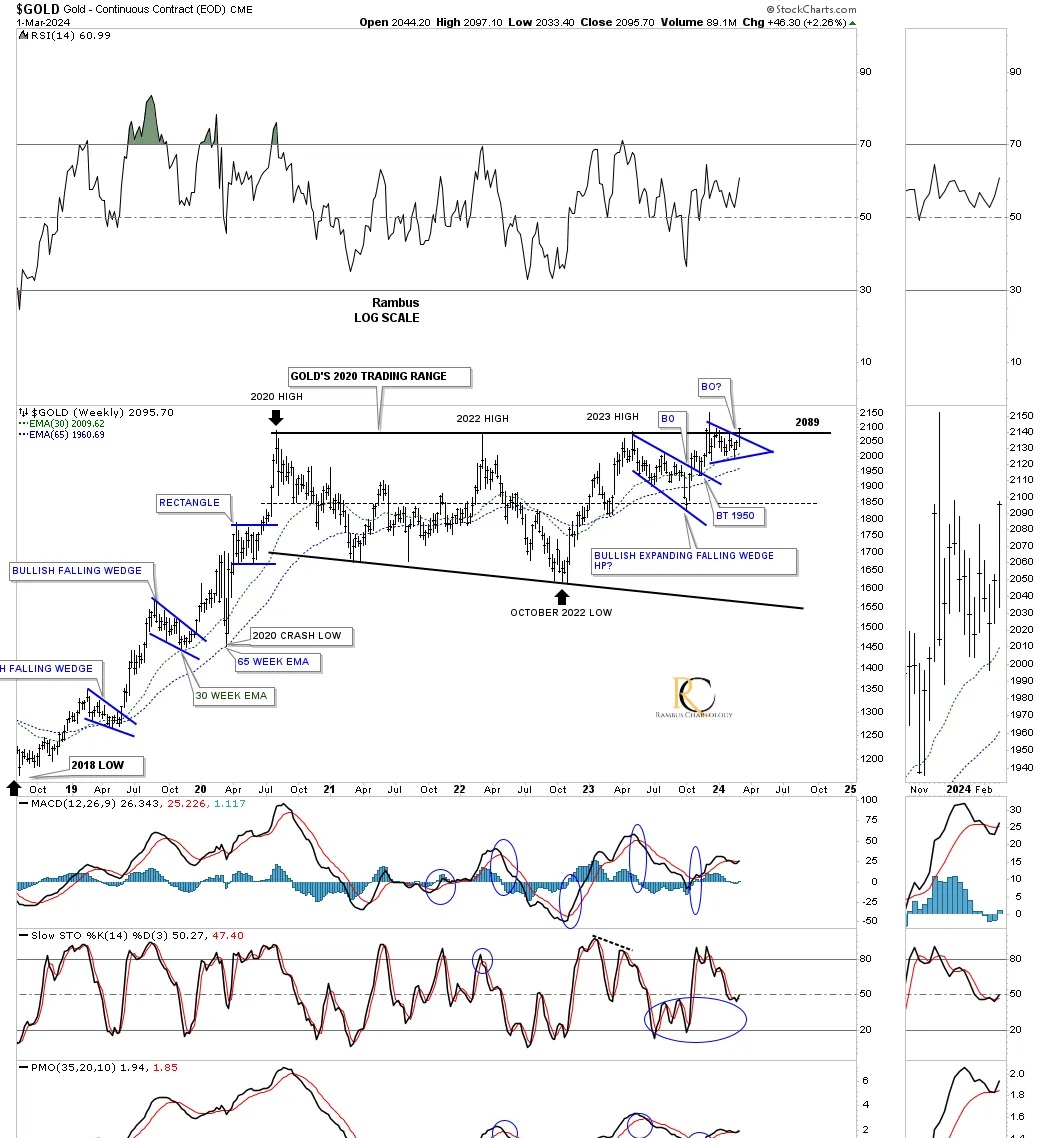
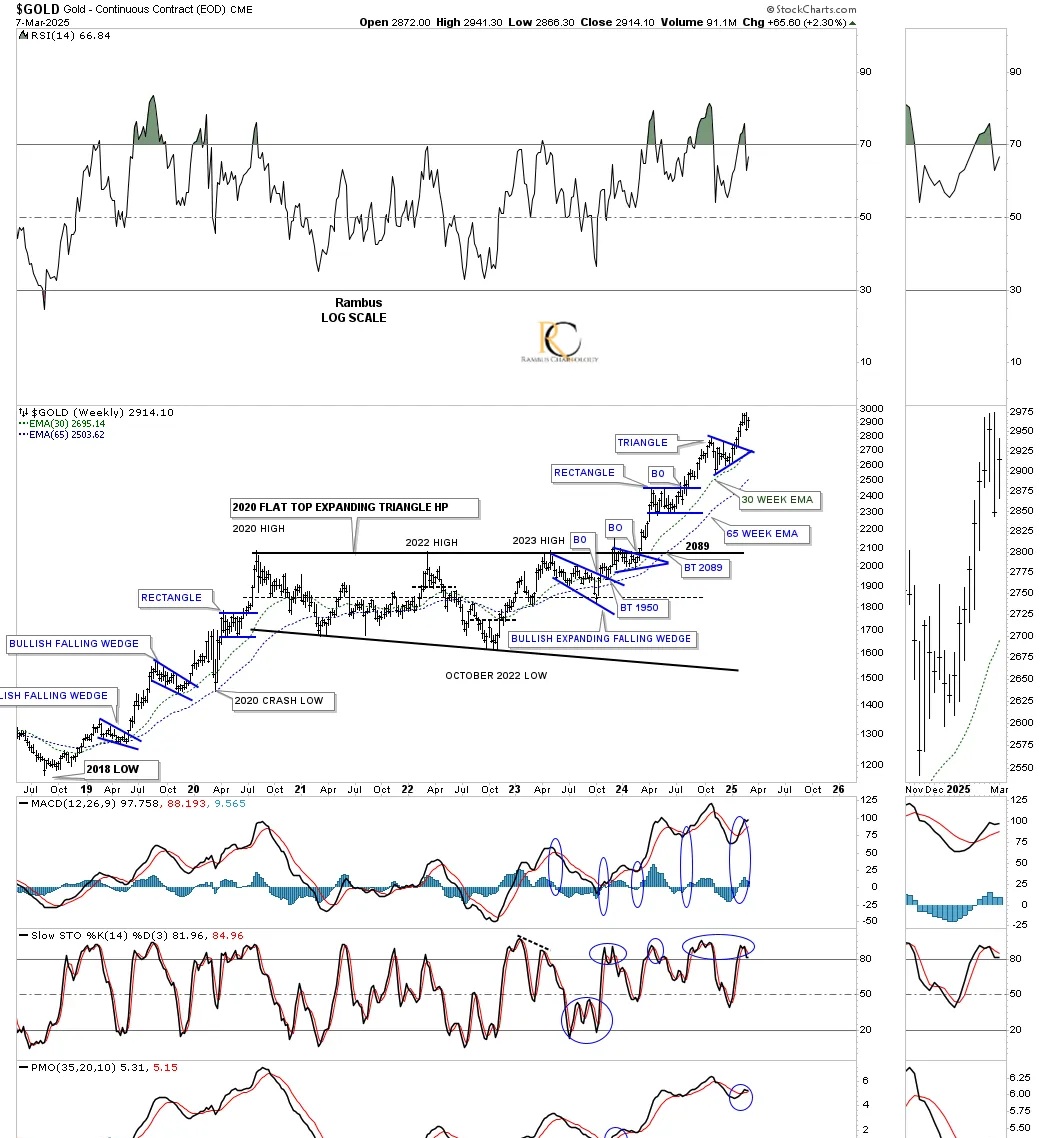
Today, March 9, 2025:
On the weekly chart above, you can see that gold was in its first week of breaking out from the 2020 flat-top expanding triangle, with a 2-for-1 breakout of the neckline and top rail of the blue triangle. Since the March 2024 breakout, two more consolidation patterns have formed.
March 2, 2024:
This weekly line chart shows the top of the 2020 trading range we’ve been following, with the breakout and the backtesting process taking place above the top rail. Now, we need to see a higher high weekly close to confirm the breakout.
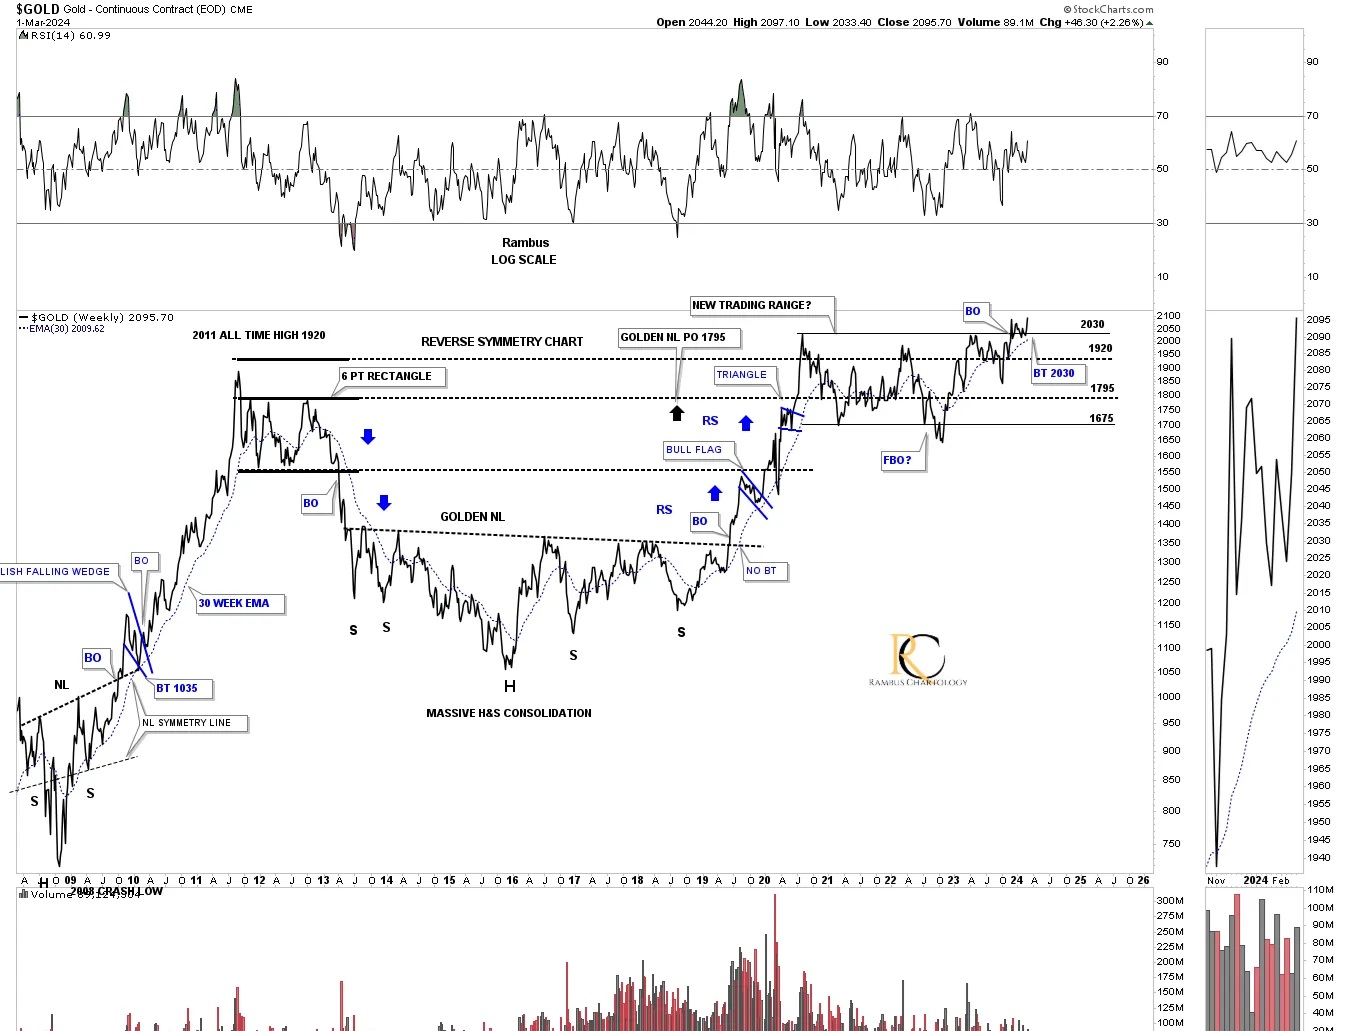
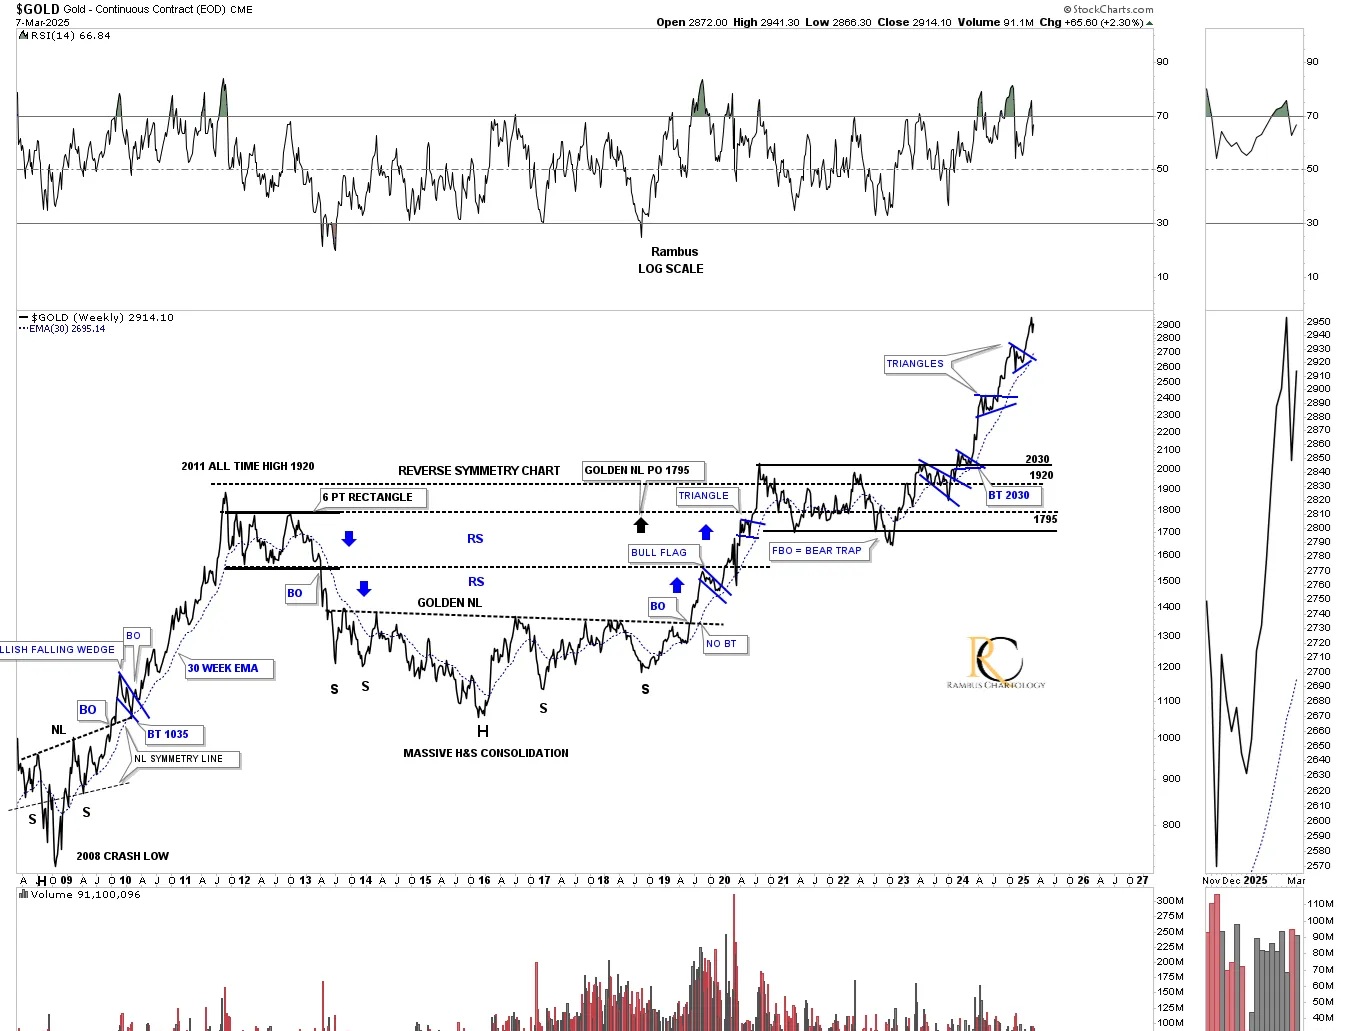
Today, March 9, 2025:
The backtest held support, and gold did make that new higher high to confirm the breakout and much more. When gold broke out from that massive 2016 head-and-shoulders (H&S) consolidation pattern with the “Golden Neckline” we never did see a backtest, which is fairly rare for such large trading ranges.
March 2, 2024:
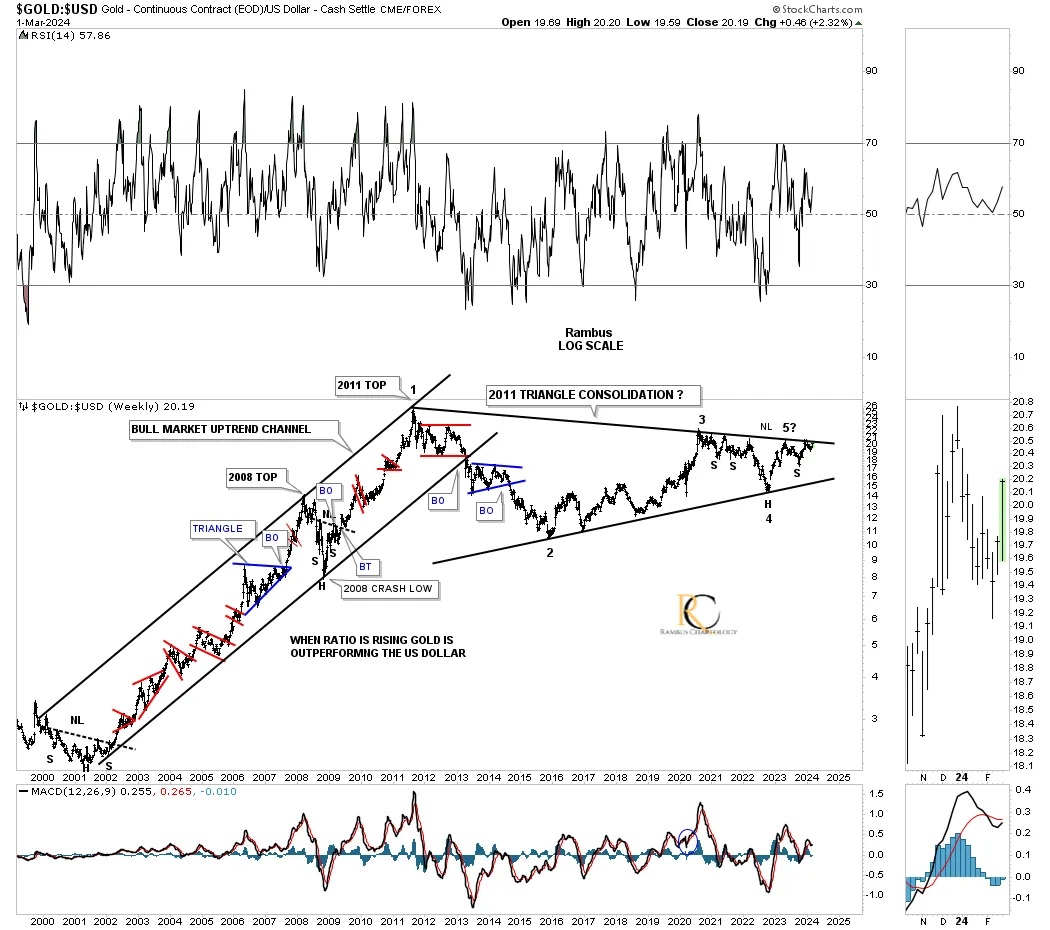
Next is the Gold:USD ratio chart, showing the price action reaching the top trendline once again. Are we going to see the breakout this time?
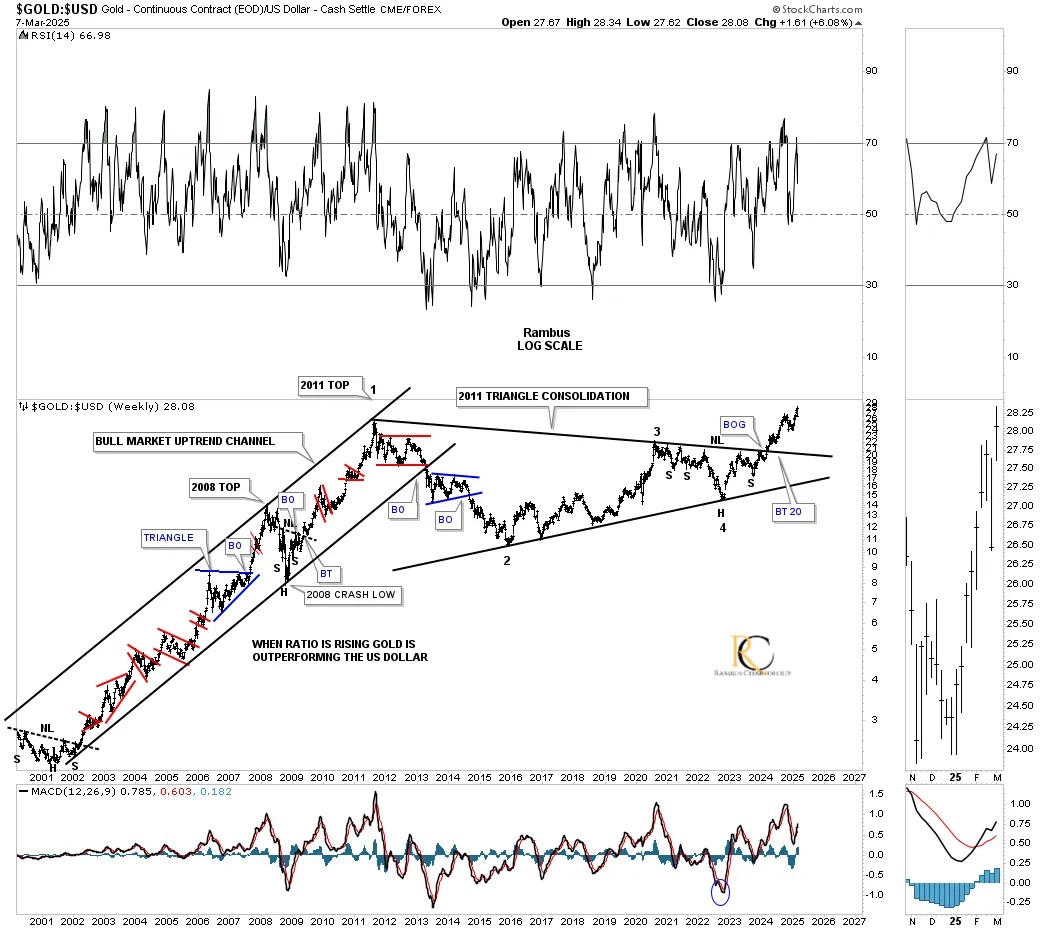
Today, March 9, 2025:
After hitting the top rail of the 2011 Gold:USD ratio chart multiple times, I asked the question on March 2, 2024, “Are we going to see the breakout this time?” The answer to that important question at that time was yes. The reason it was so important is that it completed the massive 2011 triangle consolidation pattern, which I’m viewing as a halfway pattern between the first and second legs of the secular bull market that began in 2000.
March 2, 2024:
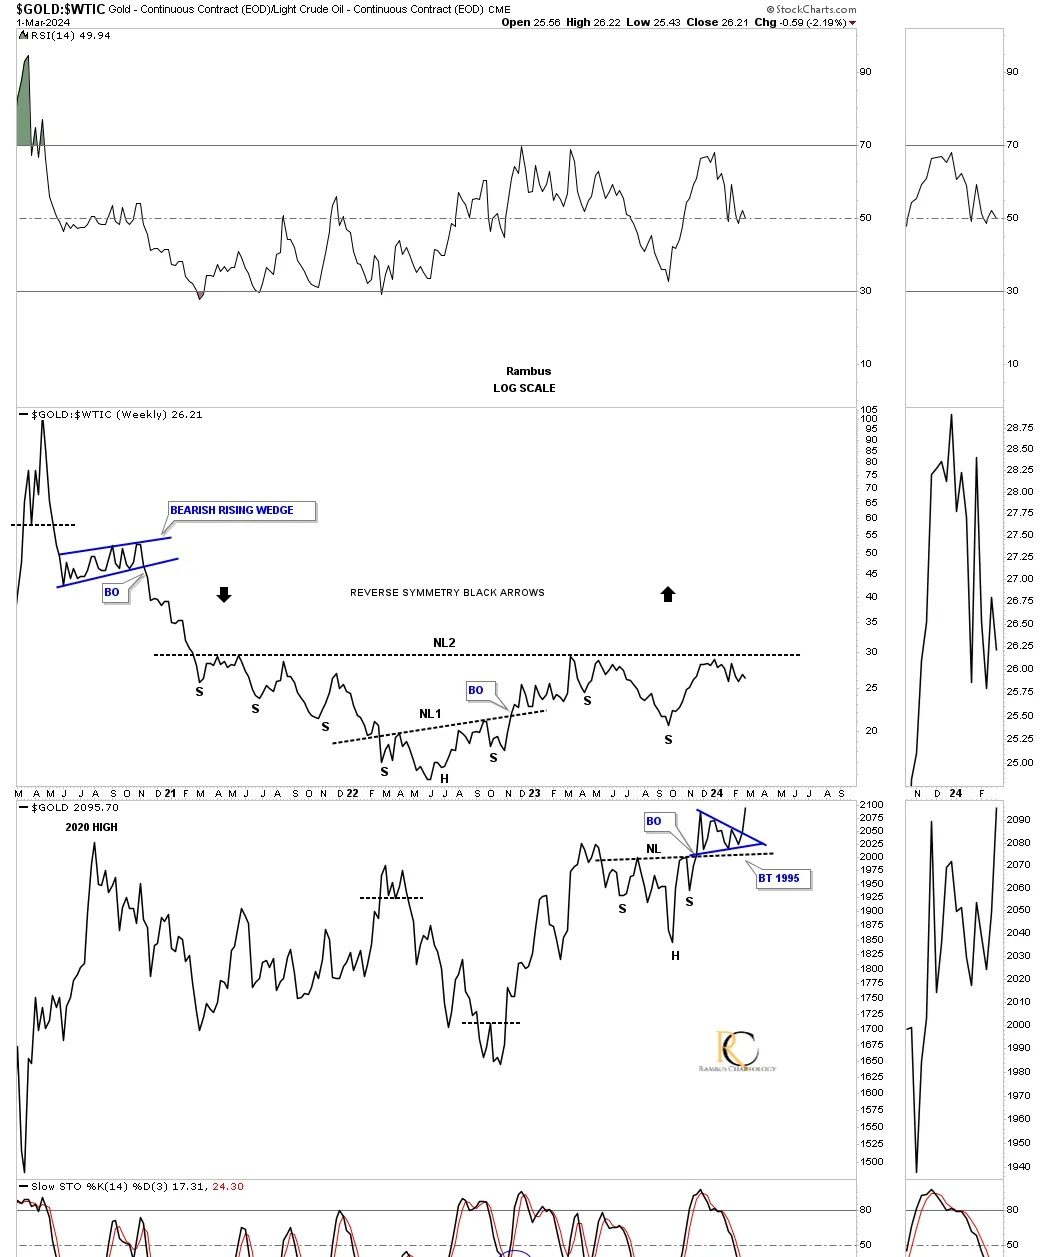
Below is a ratio combo chart, with Gold:WTIC on top and Gold on the bottom. A positive for the PM stocks in general would be to see the ratio break out above the neckline, showing outperformance of gold over oil. The lower chart shows the head-and-shoulders (H&S) consolidation pattern, with the blue triangle forming on the neckline.
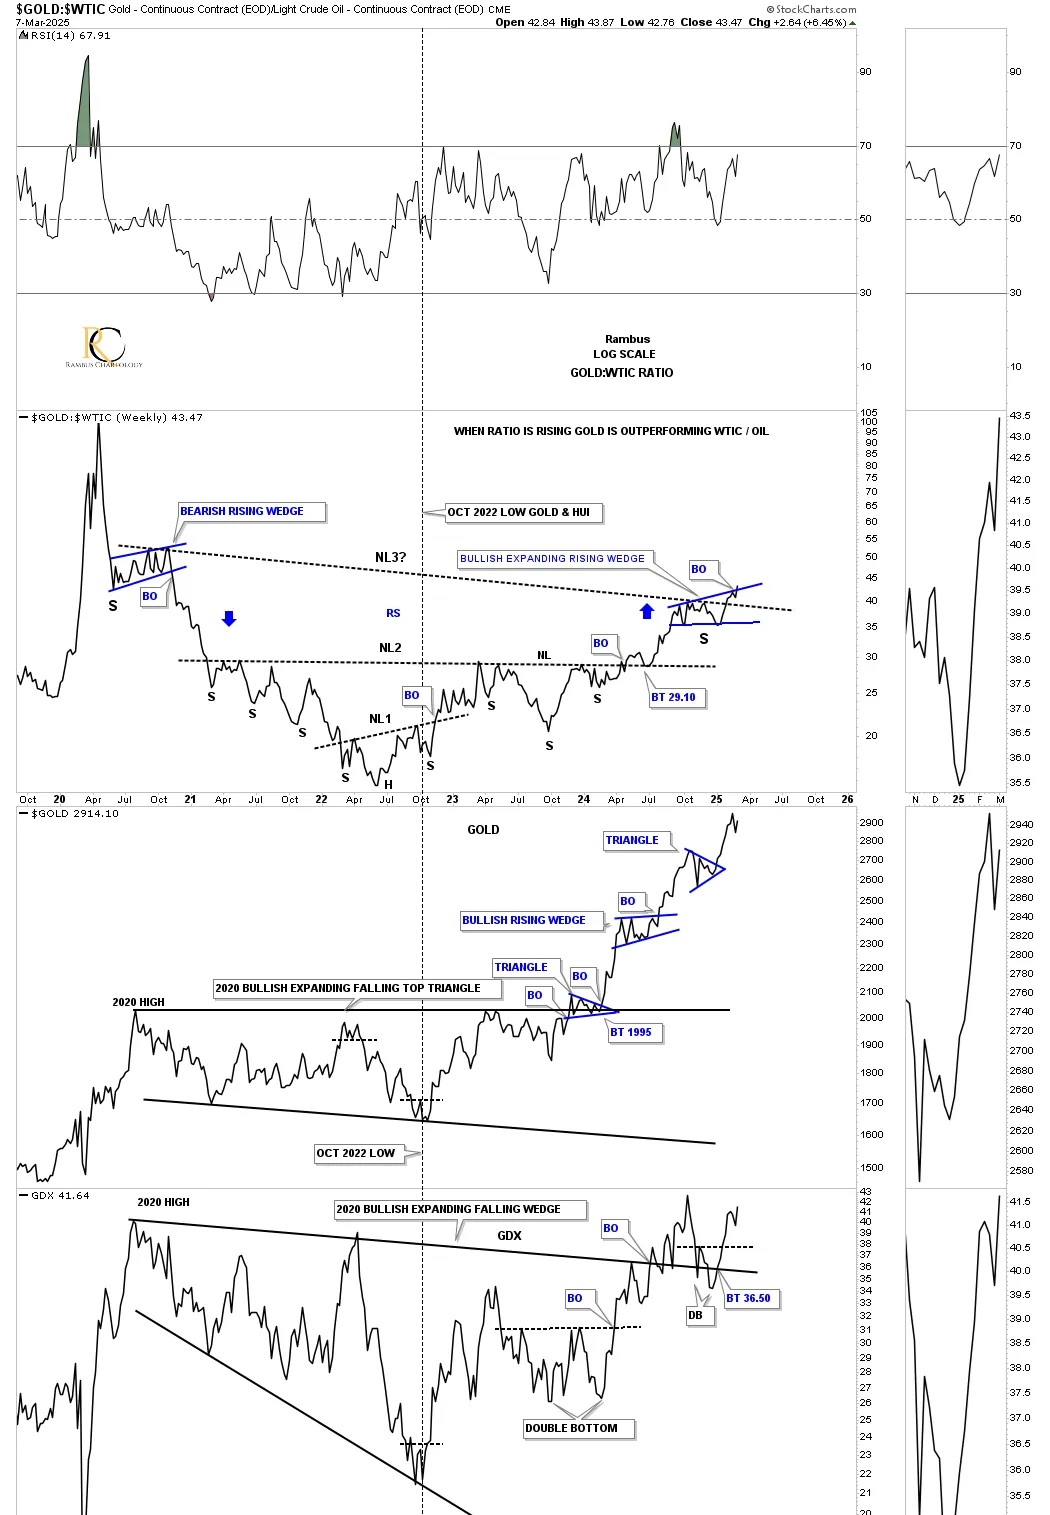
Today, March 9, 2025:
On the weekly chart above, you can see the Gold:WTIC ratio still hadn’t broken out from NL2 yet, with NL3 not even on the radar screen. I eventually added the GDX to the bottom of this ratio combo chart to show that if gold is outperforming WTIC/oil, it should be beneficial for the GDX/PM stocks, as their production costs should be moving lower.
March 2, 2024:
This daily combo chart shows SLV still working off the old neckline symmetry line, forming the possible head-and-shoulders (H&S) bottom on the bar chart, with a possible 2 1/2 point double bottom on the line chart.
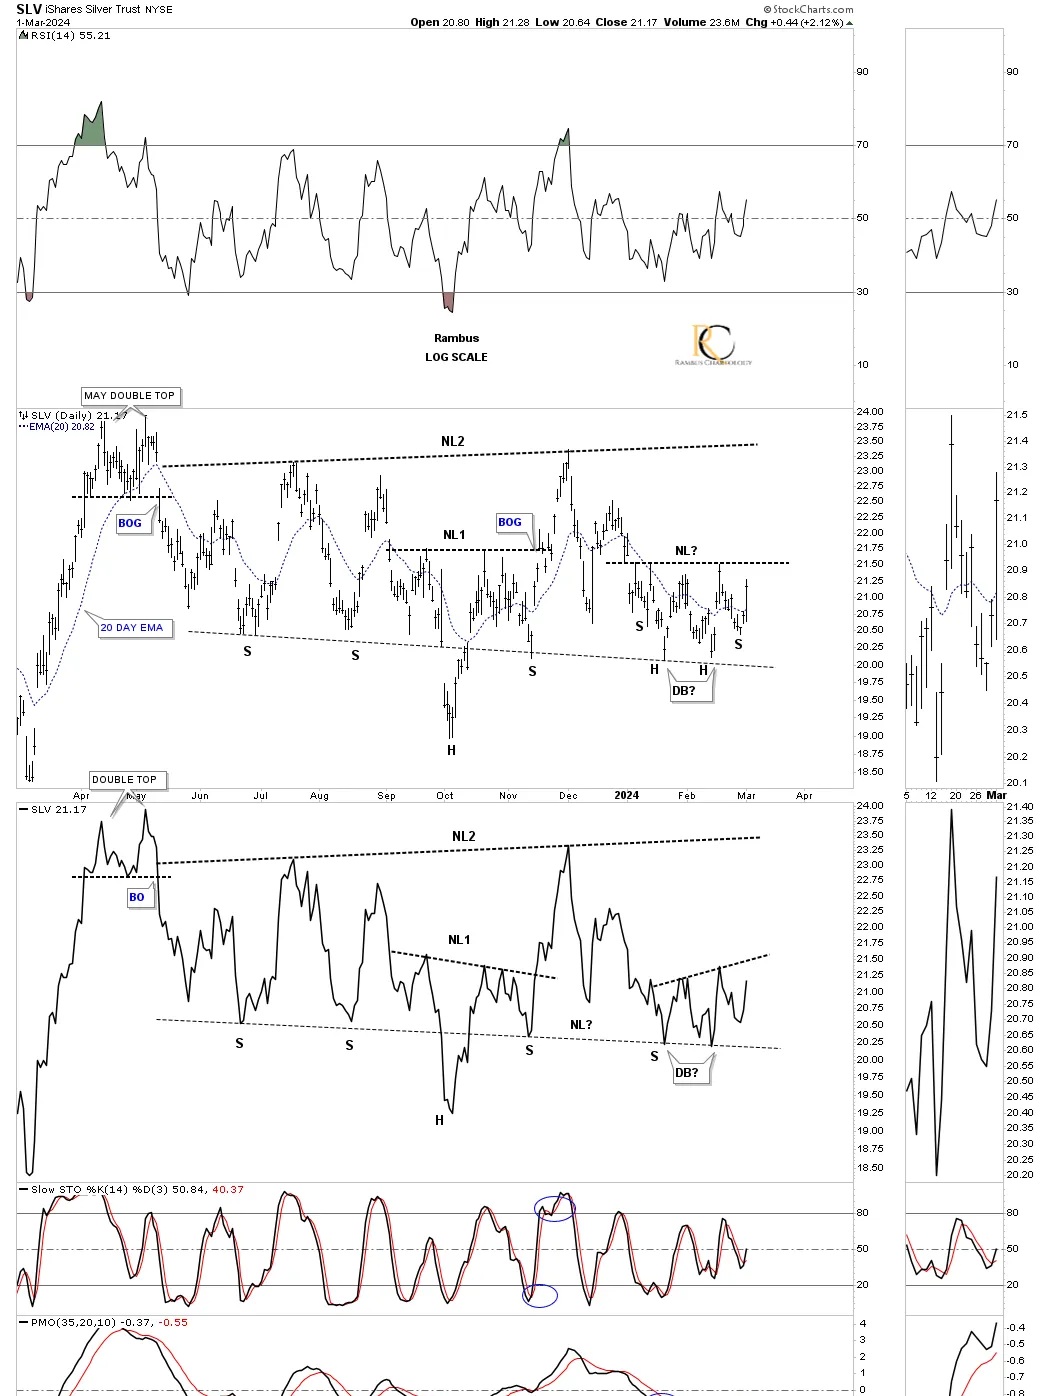
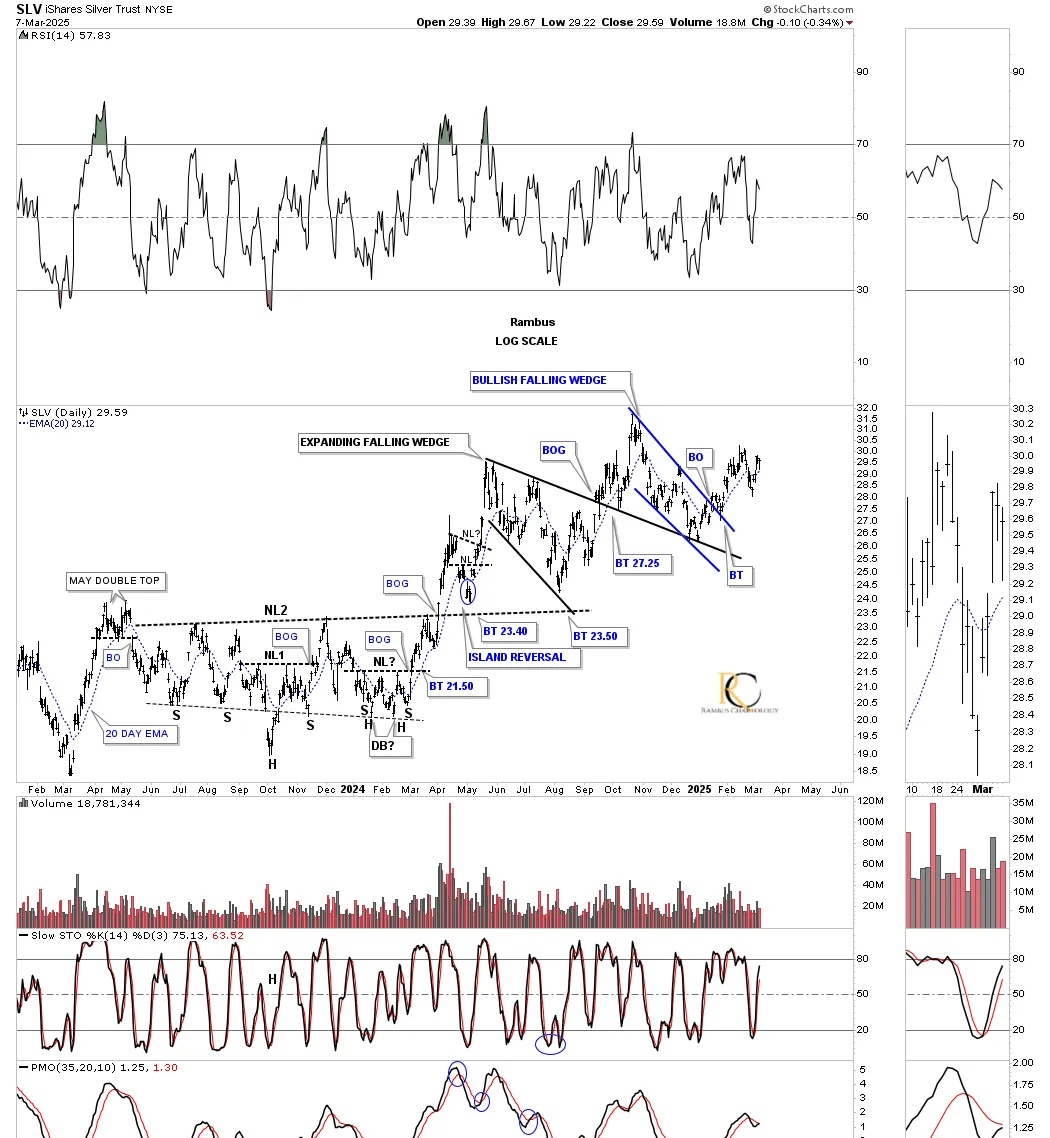
Today, March 9, 2025:
On the daily chart above, you can see the right shoulder low was forming a small head-and-shoulders (H&S) bottom, with the neckline not being broken yet. It may not feel like SLV has done that much over the last year, but when you look at the current daily chart below, a lot of work has been done. The small H&S that was forming the right shoulder low broke out to the upside, which led to the breakout of the larger H&S bottom, with a breakout gap above the neckline.
SLV then built the black bullish expanding falling wedge, with multiple backtests to the top rail, and more recently, the breakout from the blue bullish falling wedge.
March 2, 2024:
This weekly line chart shows the right shoulder still under construction of a fairly large H&S consolidation pattern.
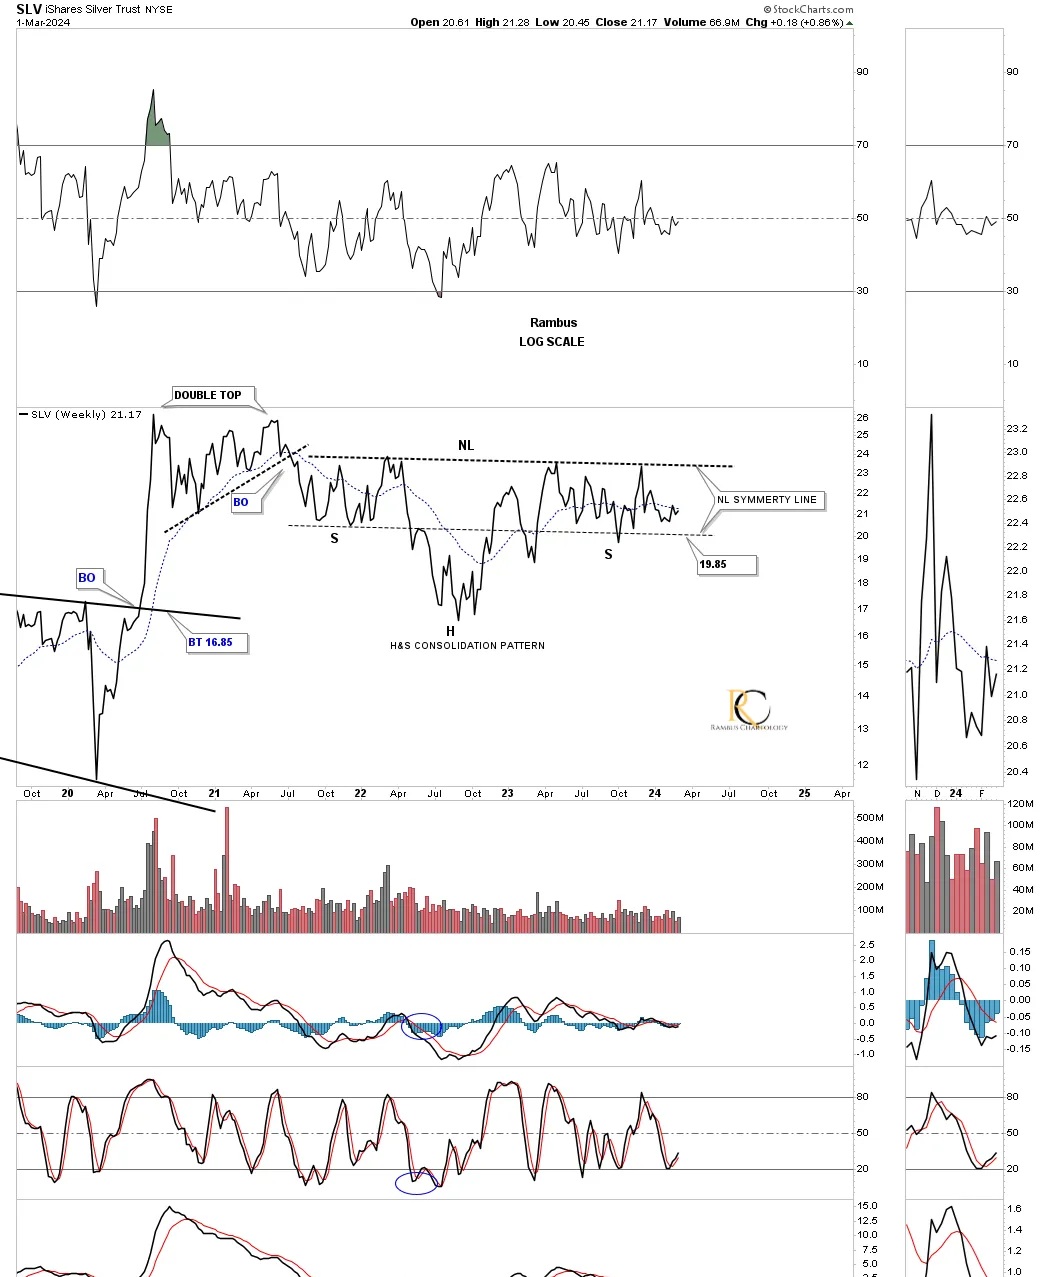
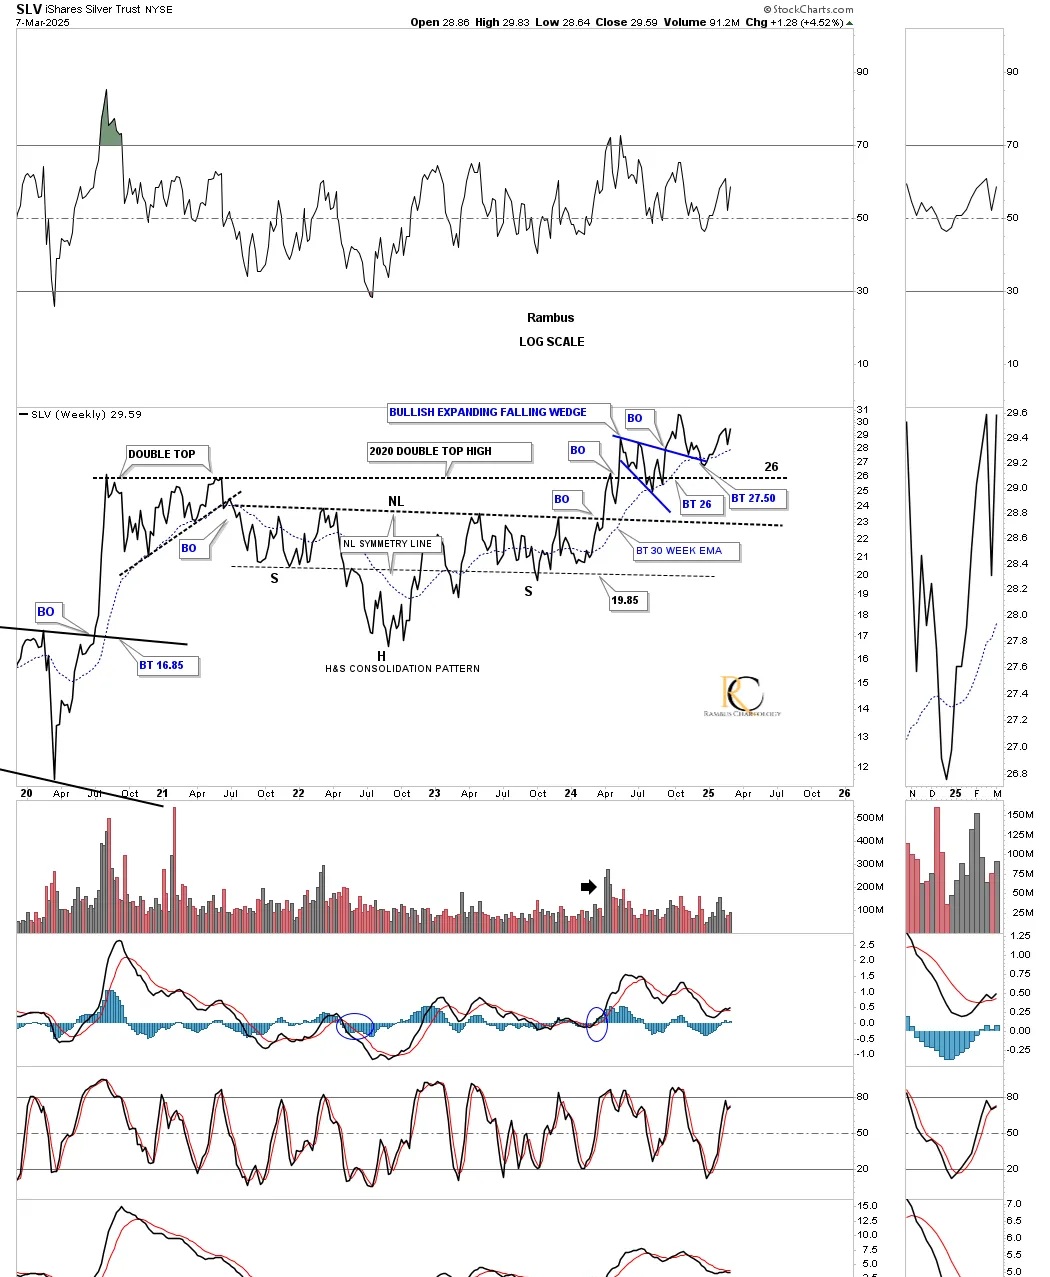
Today, March 9, 2025:
Again, a lot has transpired over the last year for the weekly chart above for SLV. First, the head-and-shoulders (H&S) bottom for the right shoulder low was completed, which, from this longer-term weekly chart, is just the H&S bottom on the daily bar chart above.
SLV went on to test the double top high made in 2020, where I added the horizontal dashed line to show how the price action may interact with it. From a Chartology perspective, the price action interacted with the double top trendline just as we were expecting. You can see the initial touch and then a small selloff, followed by the breakout and then a backtest from above, which formed the low on the blue bullish expanding falling wedge as the backtest. Keep in mind that this is a multi-year H&S base and has enough energy to launch SLV much higher when it’s ready.
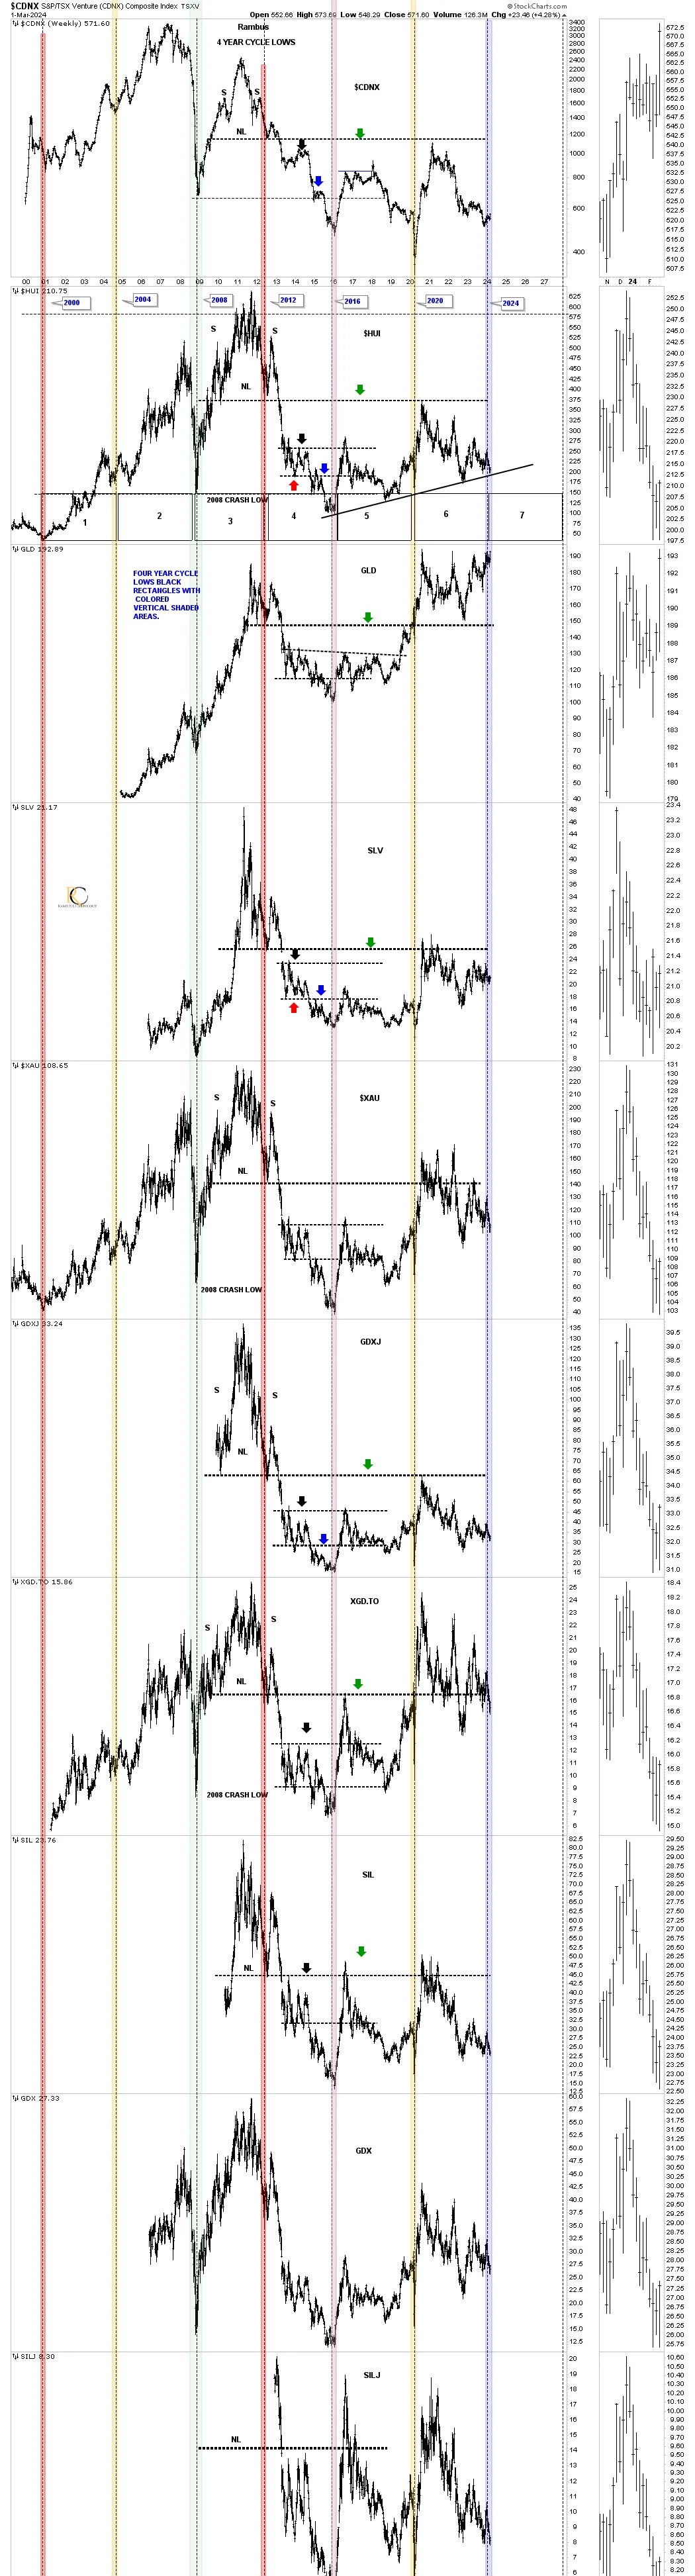
CDNX, March 2, 2024:
If the four-year cycle is still in play, we should see a rally of sorts sometime in the not-too-distant future.
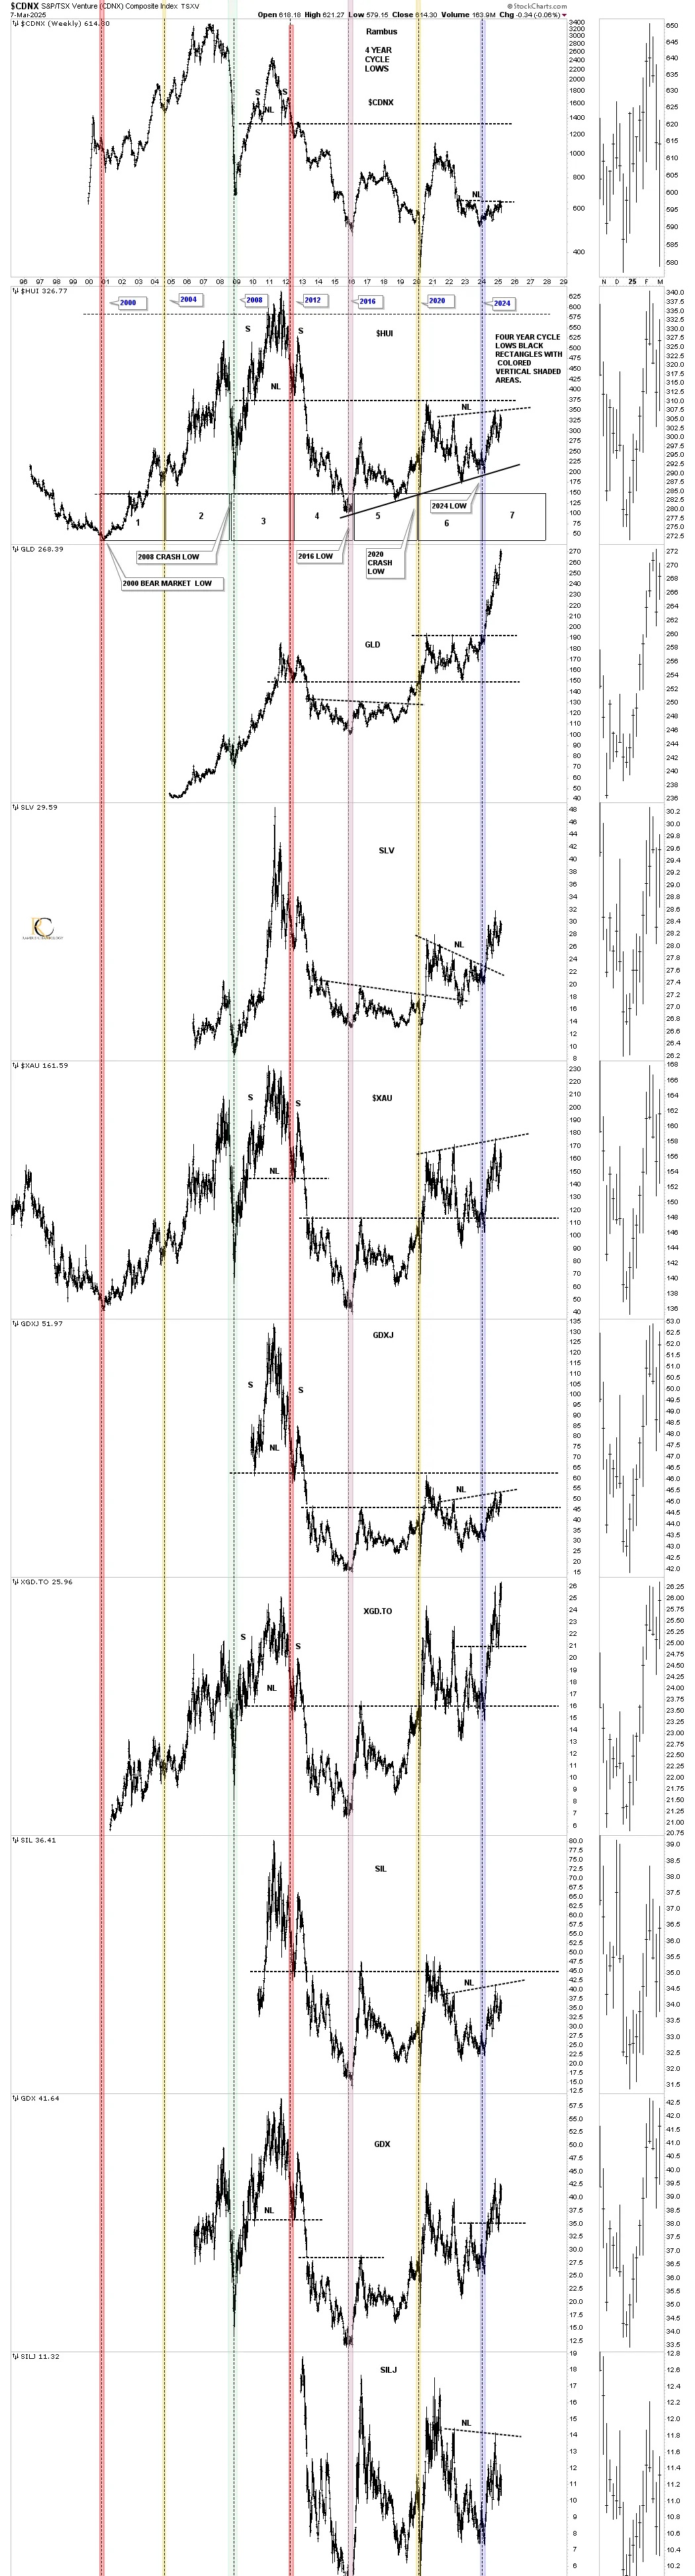
Today, March 9, 2025:
That four-year cycle low chart above did show the March low, and the rally that ensued over the last year. From this long-term perspective, we can even see some head-and-shoulders (H&S) bottoms forming, with SLV already breaking out above its neckline, while several others are still in the process of completing their right shoulder.
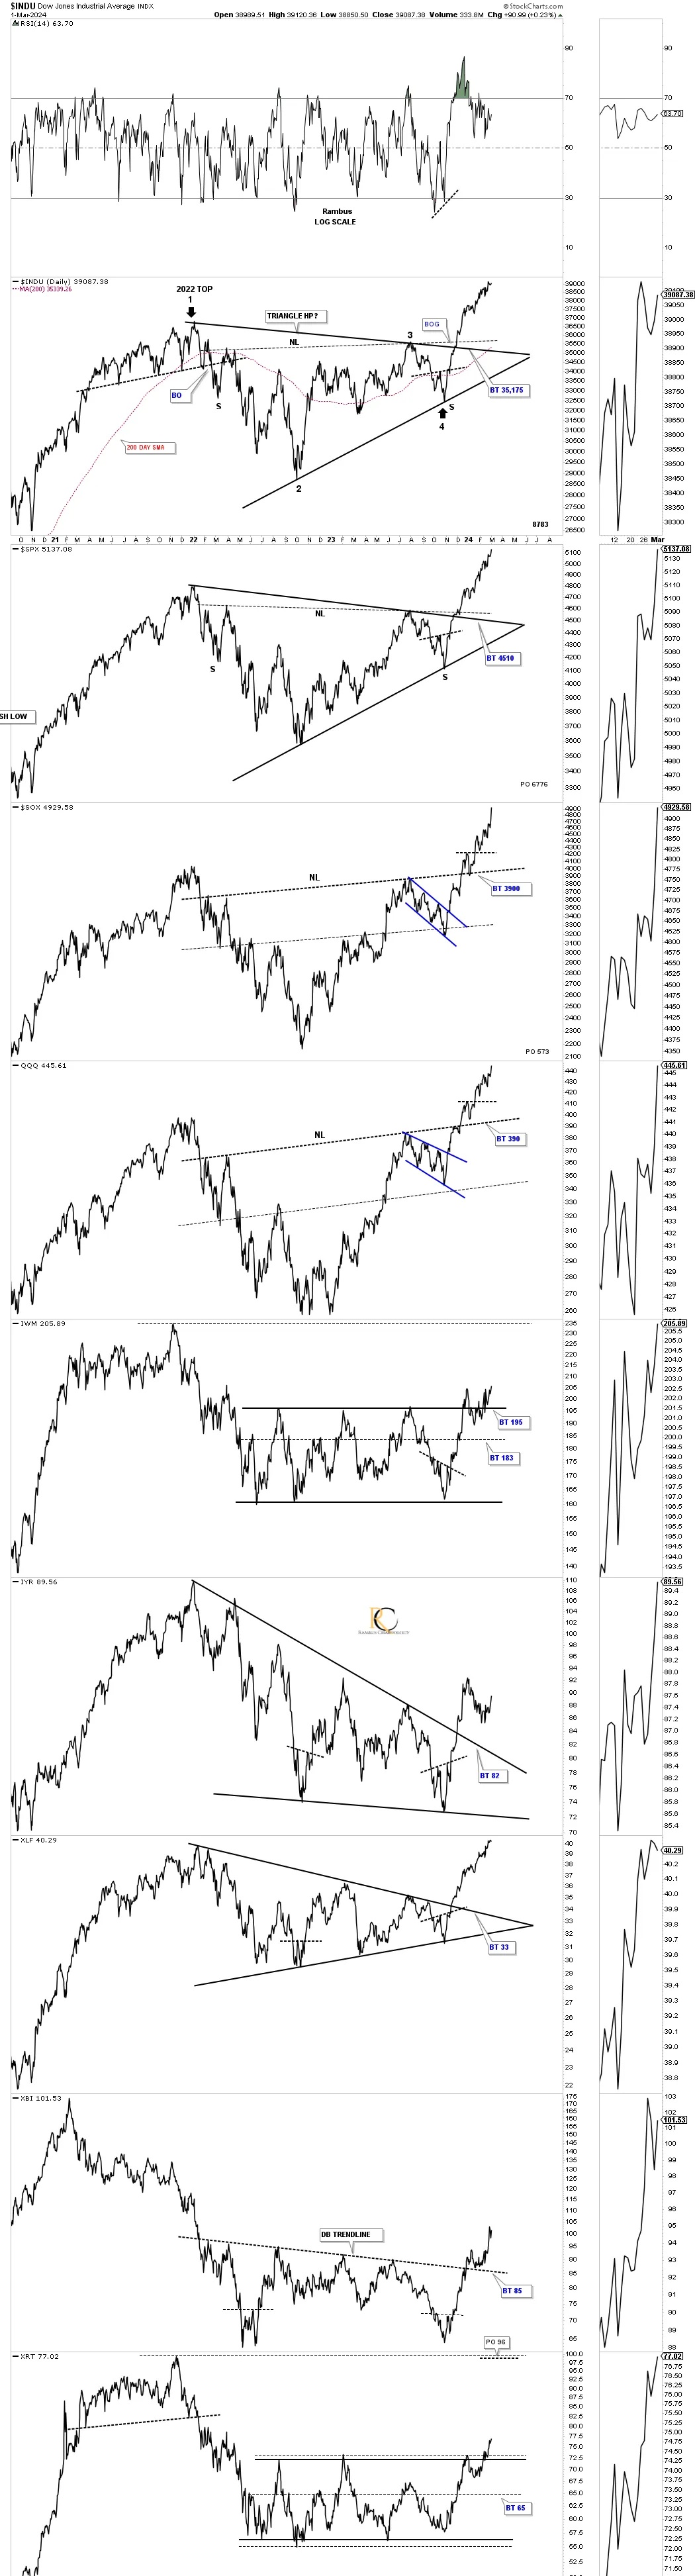
Also included in the March 2, 2024, Markets Update, was this daily combo chart for the US stock markets.
March 2, 2024:
Next is the daily line chart for the US stock market, which shows the breakout from the 2022 consolidation pattern. Some of the laggards are starting to come alive, with a new higher high taking place in most cases.
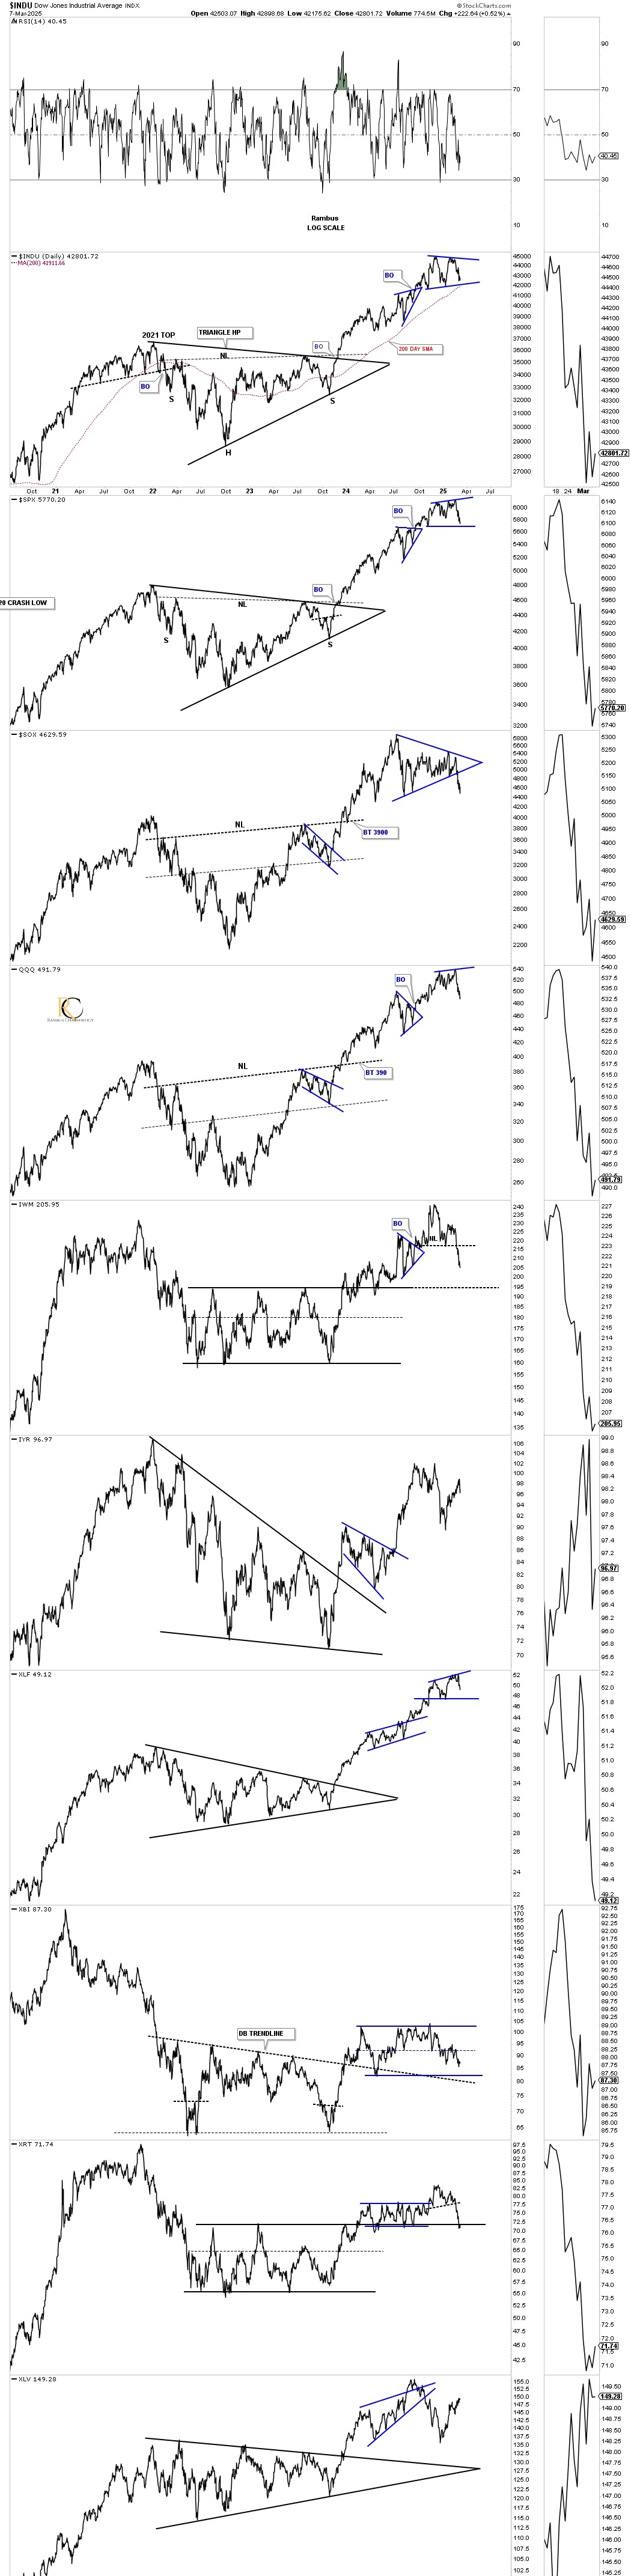
Today, March 9, 2025:
Since December of last year, many of the US stock indexes have been either building a consolidation pattern or a topping pattern, which is still too early to know yet. Unless the INDU, SPX, and the QQQ are putting in a double top, there is still the 4th reversal point that needs to be found.
The SOX may have completed a 5-point triangle reversal pattern, but the last reversal point high failed to reach the top trendline, while the IWM shows a small head-and-shoulders (H&S) top that may find support on top of its rectangle consolidation pattern. The XRT is currently backtesting the top of its rectangle.
The sentiment is extremely bearish right now, which is where bottoms are found, but negative readings can last quite a while.
I would like to finish up by looking at the 2011 massive head-and-shoulders (H&S) consolidation patterns for silver and gold.
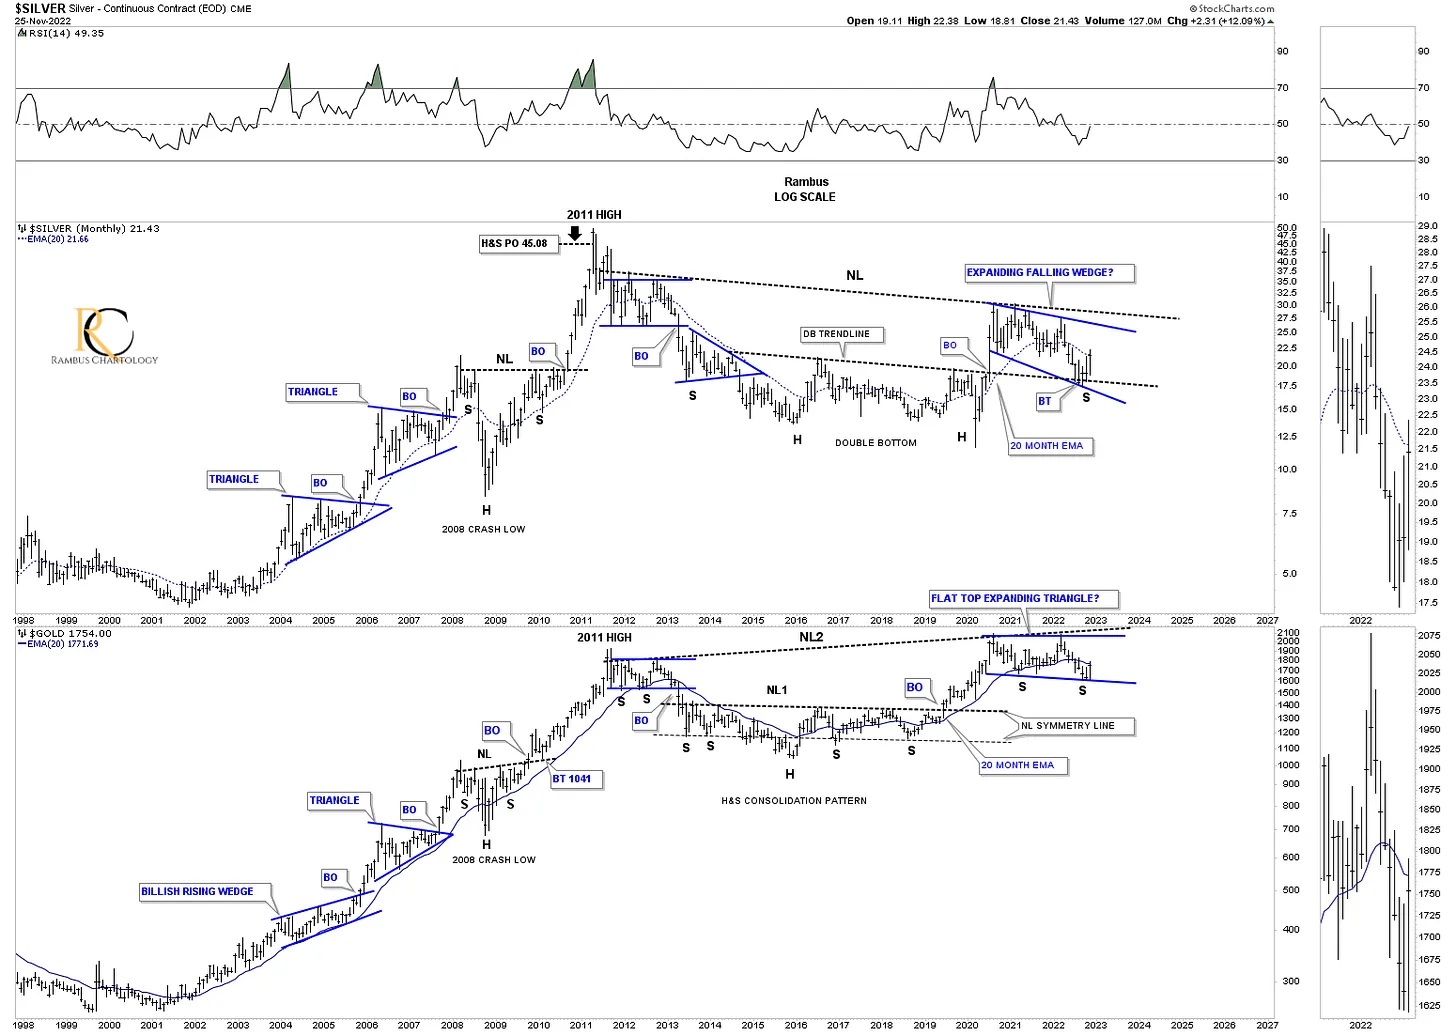
November 27, 2022:
This is how I finished up the Weekend Report on November 27, 2022, almost 2 1/2 years ago.
As long as the bottom trendline on the 2020 trading ranges holds support, the secular bull markets that began at the 2000 low remain intact, which gives us a low-risk entry point. When you look at these charts, you will see that low-risk entry points don’t come around all that often, but when one presents itself, it is worth the risk to try to get positioned in what could be the beginning of a very important rally that could last for many years to come. We have a very clean line in the sand that separates bullishness from bearishness. All the best…Rambus
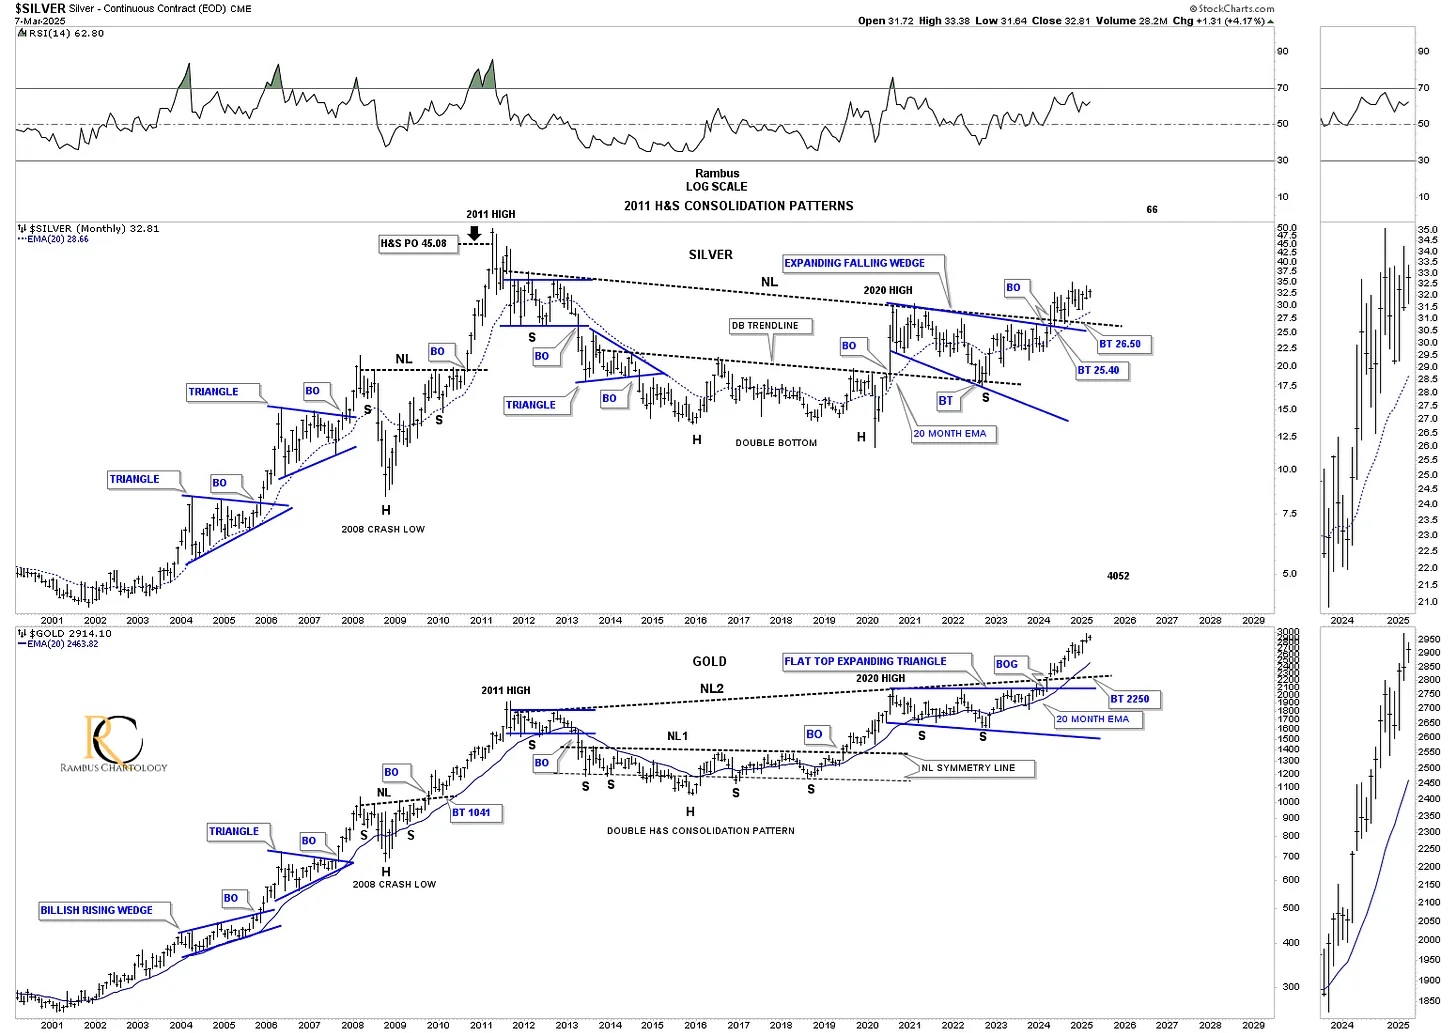
Today, March 9, 2025:
As you can see, the November 27, 2022 low, which was testing the bottom rail of the 2020 bullish expanding falling wedge, was also the right shoulder low of the massive 2011 head-and-shoulders (H&S) consolidation patterns, which has been playing out beautifully over the last 2 1/2 years.
At the beginning of this “Weekend Report,” I mentioned that one never knows for certain if what you think is going to happen actually happens the way you think it will, until you can look back in hindsight, which is the only true arbiter between fact and fiction.
I think that, looking back nearly 2 1/2 years on this monthly combo chart, we can now say with hindsight that the right shoulder low was indeed being completed in November 2022 in both silver and gold.
These massive H&S bases are strongly suggesting that the precious metals (PM) complex has many more years left to run before the secular bull market that began in 2000 is over and the next secular bear market begins. How one takes advantage of the ensuing bull market is a different matter altogether. All the best…Rambus
********
 Meet Rambus, a seasoned trader and technical analyst renowned for his unbiased and insightful chart work. Through his website, Rambus Chartology, and Substack newsletter, Rambus shares his expertise with a global community of subscribers, providing daily updates, commentaries, and hands-on training in the art and science of chartology. With his calm, humble, and down-to-earth approach, Rambus demystifies complex market trends, helping his followers navigate the challenges of today's volatile markets. Join the Rambus Chartology community today and discover a unique blend of technical analysis, trading expertise, and time-tested protocols. Subscribe now at www.rambus1.com or https://rambuschartology.substack.com/
More from Gold-Eagle


