Forecast: 'Secret' Message for Gold & U.S. Stocks
 share
share
 share
share
 share
share
 share
share
 share
share
 From comments made in my past articles, Gold was ideally headed down into the late- May to early-June window, before setting up the next key low. With the recent action, we have either formed that low (yet to be confirmed), or else we have a marginally lower low still out there for the swing.
Gold's 72-Day Cycle
The 72-day cycle is - at least at present time - the most dominant cycle for Gold. This cycle was projected higher into April of this year, where it was expected to turn south into the late-May to early-June window.
Shown again is our 72-day cycle component:
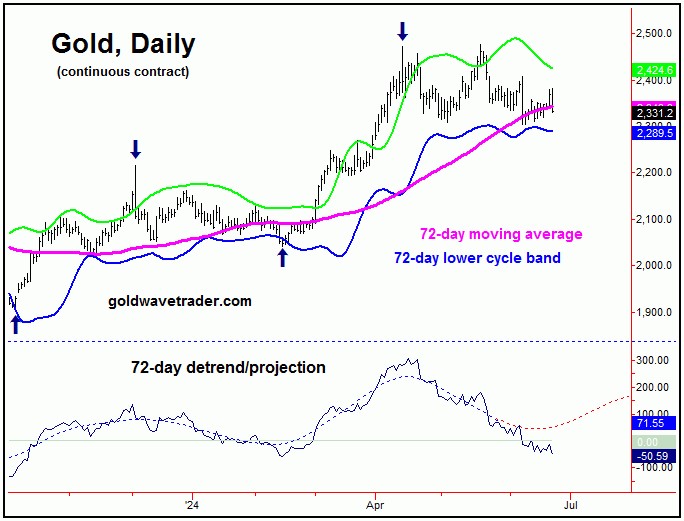
In terms of price, our ideal minimum price decline with this 72-day cycle called for a drop back to the 72-day moving average - which was met earlier this month. Having said that, a good-majority of 72-day cycle downward phases will also see a drop back to the lower 72-day cycle band, currently at the 2289 figure.
With the above said and noted, until the next upward phase of this cycle is confirmed to be in force, there is the 'risk' for a drop back to this lower 72-day band in the days ahead, before bottoming the swing.
Adding to the above, we do have a new upside 'reversal point' for our 72-day cycle, which is an exact number, that - when taken out higher - will confirm its next upward phase of this wave to be back in force, with precise details in our thrice-weekly Gold Wave Trader market report.
The 'Stepped-Back' View for Gold
With the above said and noted, our 72-day wave in Gold has either bottomed, or else has a marginally lower low still out there.
In terms of price, the next upward phase of our 72-day cycle - once in progress - is favored to see a rally in the range of some 10-14%. With that, should the 2304.20 swing low end up as the bottom for this cycle (still unclear), then there would be the potential for a spike up to the 2534-2626 region into late-July.
Otherwise, if a lower low is still out there for our 72-day cycle, then we will have to recalculate our potential upside target range.
Either way, a decent rally is expected to play out in the next month or so, though it is expected to be limited - due to the configuration of our bigger 310-day component.
The 310-day Cycle
Above the 72-day wave for Gold, there is a larger 310-day wave, which is fairly dominant - and sets the trend for the mid-term picture.
Shown below is that 310-day cycle for Gold:
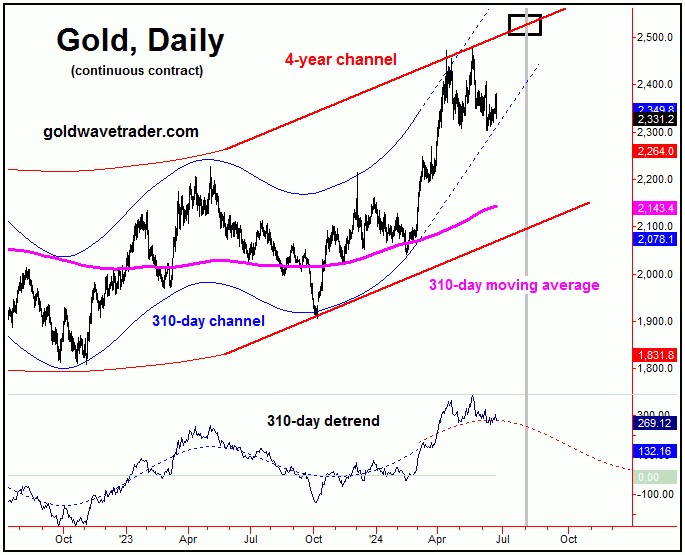
The last bottom for this 310-day wave was the October, 2023 low of 1907.50. From that low, our analysis projected a 20-25% rally (forecast well in advance) - playing out into the Spring/Summer of this year, which has obviously been seen.
Until proven otherwise, this 310-day cycle is still seen as pointing gently higher - but is moving into topping range, and with that could 'turn' at anytime. Its next trough - if made on schedule - is due to form later this year.
With the above said and noted, if we extrapolate our upper 310-day cycle channel into late-July, we get the 2500's for Gold - which tends to line up with the aforementioned (potential) target range. On or after that point, this 310-day wave should form its next top, giving way to what is expected to a very sharp decline in the months to follow.
In terms of patterns, however, the next correction phase of our 310-day cycle is favored to end up as a larger countertrend affair. With that, a late-2024 bottom with this cycle - if seen as expected - should give way to another sharp rally into what looks to be the Summer of next year, before topping our largest-tracked wave - the four-year cycle - with a precise target for this wave noted in our Gold Wave Trader report.
U.S. Stocks Bracing for Decline
Like the Gold market, the U.S. stock market also has several dominant cycles, with the next key peak expected to come from our 90-day cycle.
Shown below is that 90-day wave, for the S&P 500 index:
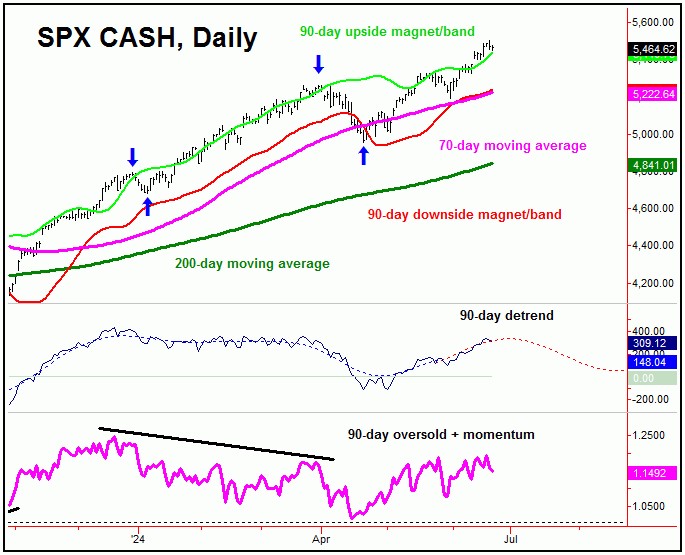
In terms of time, our cyclic detrend indicator suggests this 90-day cycle is going over a top, and with that is looking for its peak to form soon - with its next trough projected for the mid-August timeframe of this year, plus or minus.
In terms of price, the 5560-5650 SPX CASH region - if tested in the coming weeks - is a major resistance level for this index. Once this wave does top, the 70-day moving average would be an ideal price magnet into that mid-August window.
Having said the above, there is at least some (though outside) potential for a spike on down to the lower 200-day moving average into that timeframe, simply due to the technical configuration of the market.
Take a look at the next chart:
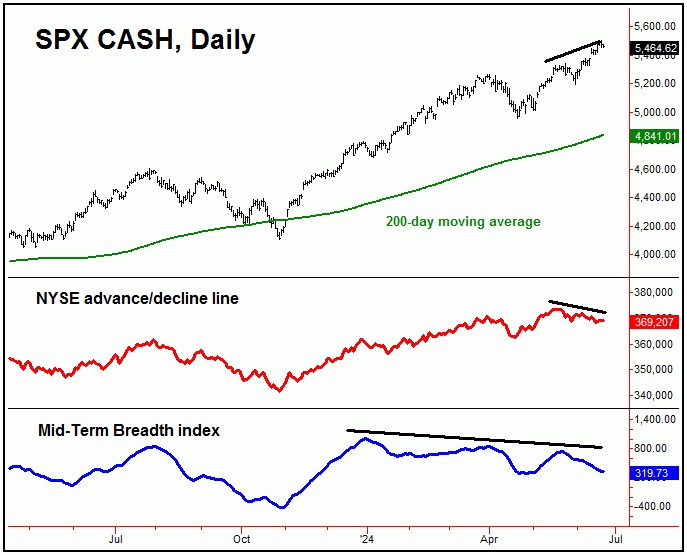
With the recent push to higher highs on the SPX, the NYSE advance/decline line (red, above chart) is showing a decent divergence against price - which is viewed as a technical negative for the SPX - and thus is supportive of a decent correction, coming from our (aforementioned) 90-day time cycle.
Going further with the above, our Mid-Term Breadth index (lowest pane, in blue) is also showing a divergence against the new price high. The combination of these are normally proceeded by key market tops for the U.S. stock market, and should not be ignored. At minimum, traders should now take on a defensive mindset going forward.
U.S. Stocks Sentiment
One of the key indicators that we track in our weekly Market Turns report (which tracks the U.S. stock market is sentiment, as per our stock market sentiment index, which is shown on the chart below:
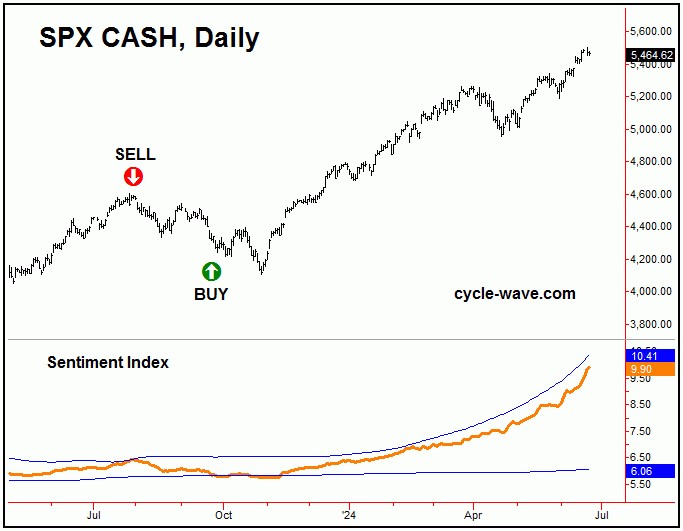
Our stock market sentiment index last dropped below its lower 'buy' line at the 9/22/23 close of 4320.06 SPX CASH, with its prior 'sell' signal coming right at the July peak from last year. Signals do not come often with our sentiment index - normally only once or twice per year.
With the action into last week, our sentiment index has seen a continued rise - though is still below its upper reference line, thus keeping its buy signal in place. Having said that, this looks set to change at anytime going forward, which is noteworthy - considering (1) the position of our 90-day time cycle, and (2) the bearish action of internals in U.S. stocks; stay tuned.
Jim Curry
The Gold Wave Trader
Market Turns Advisory
http://goldwavetrader.com/
http://cyclewave.homestead.com/
*******
share
share
share
share
share