Technical Trades of The Week SPX, U.S. Dollar, Nat Gas
 share
share
 share
share
 share
share
 share
share
 share
share
Yesterday's price action was very bearish yet again and we are patiently waiting for a counter trend pullback to happen. While three are some good looking plays out there I really do not want to get long until the market clears the air with a bout or three of strong selling. Remember 3:4 stocks follow the market and the odds of picking a commodity or ETF that bucks the trend is unlikely.
S&P500 / Broad Stock Market
We have seen a bug run up in stocks this month and things are looking a little long in the teeth. A large number of stocks are trading above their upper Bollinger band and the broad market is testing that key resistance level also. Typically when a Bollinger band is reached we see price reverse for a couple days at minimum.
While the equities market is in a new uptrend as seen by the moving averages I pullback seems imminient. The last two days has formed reversal candles and are pointing to lower prices.

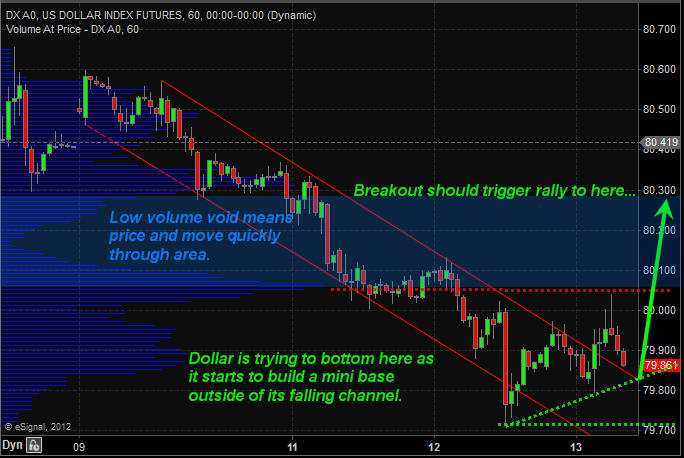
U.S. Dollar Index Hourly Chart
This chart shows a possible bottom forming in the dollar pointing to a 3-8 day pullback in stocks.
Gold Futures Hourly Chart

Natural Gas Hourly Chart

Morning Trading Conclusion
Looking at the charts on several different time frames, not all shown here, technical analysis shows a pullback in stocks is highly likely. This is what we are currently positioned for.
The US dollars downward momentum is slowing and if it can find a bid today it should trigger strong selling in both stocks and commodities. Gold and silver are down sharply along with miners.
We have been watching natural gas for a few months and know that it has been trading inverse to what stocks do. This bodes well for a bounce in natural gas if stocks start a selloff. That being said, natural gas is trading at a key tipping point that could spark a very fast and hard drop. This knife can fall at a speed that will take a slice out of your trading account if not traded and managed properly (tiny position and use of a stop). I actually like natural gas the more it moves down and could issue a buy alert on it today or this week. I would like to see volume decline at this level showing the momentum is slowing…
share
share
share
share
share

Chris Vermeulen has been involved in the markets since 1997 and is the founder of Technical Traders Ltd. He is an internationally recognized technical analyst, trader, and is the author of the book: 7 Steps to Win With Logic
Through years of research, trading and helping individual traders around the world. He learned that many traders have great trading ideas, but they lack one thing, they struggle to execute trades in a systematic way for consistent results. Chris helps educate traders with a three-hour video course that can change your trading results for the better.
His mission is to help his clients boost their trading performance while reducing market exposure and portfolio volatility.
He is a regular speaker on HoweStreet.com, and the FinancialSurvivorNetwork radio shows. Chris was also featured on the cover of AmalgaTrader Magazine, and contributes articles to several financial hubs like MoneyShow.com.