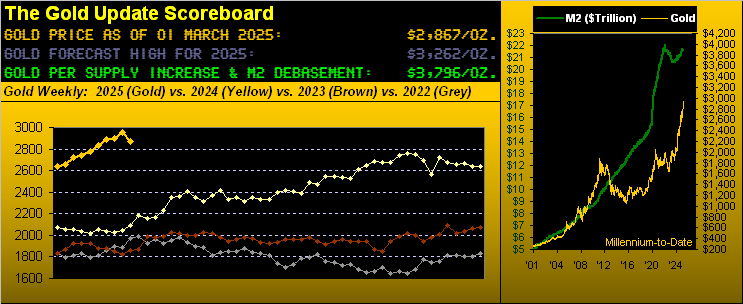
Thank Goodness Gold Finally Falls
 share
share
 share
share
 share
share
 share
share
 share
share
Not that we’ve been rooting for Gold to fall, but it being one of the world’s most substantive liquid markets, it implicitly both rises and falls in its interactive role — that reflecting the cost of currency debasement — as one of the five most important financial stores of value along with the Bond (the cost of money), the Euro (or major currency of your choice as the cost of foreign flows), Oil (the cost of the global economic engine) and the S&P 500 (or major market index of your choice as the cost of equity risk). We of course refer to this high-level grouping as BEGOS: (Bond / Euro / Gold / Oil / S&P 500).
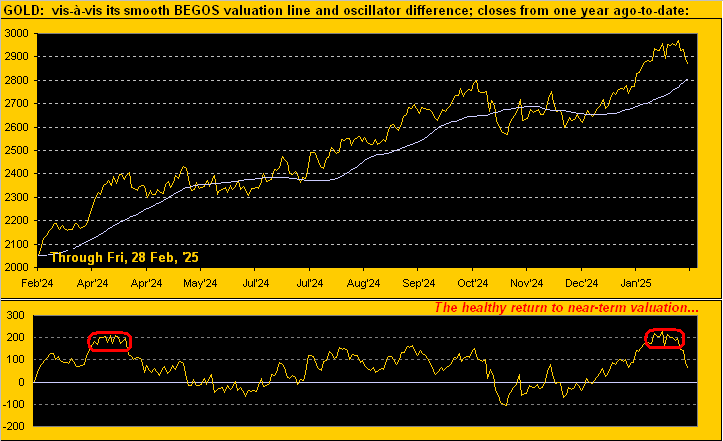
And from one trading day to the next, each of these five markets at the macro level basically receive and distribute money from one another. In turn, their combined changes in price elicit a valuation for each component as updated daily on the website’s Market Values page. And if you’ve been paying attention, Gold across the past few weeks was getting wildly up beyond valuation, our having emphatically pointed to such state in the prior two missives. But now finally facilitated is Gold’s requisite fall, healthy in spite of it all:
‘Course contra to our wary stance — courtesy of the FinMedia — emerged the “Suddenly Everybody’s a Gold Expert Dept.” proclaiming the price of 3000 being imminent. And thus it did not happen, oft normal in such market-amateur hysterias.
Rightly instead, Gold as anticipated whirled ’round down to record its third worst week in better than a year, this time dropping -2.8% (-82 points) in settling yesterday at 2867. Or to put it to music, we cue the Swiss rock band Gotthard from their ’07 song “The Call”:  “The higher they fly, the harder they fall…”
“And, mmb, that really applies now to the stock market, eh?”
Frighteningly so, Squire. Indeed to quote George Kennedy in “The Eiger Sanction” (Universal, ’75): “They won’t even know it’s coming until it hits.” Or as a valued charter reader of The Gold Update has on occasion queried: “Does it really matter which snowflake causes the avalanche?”
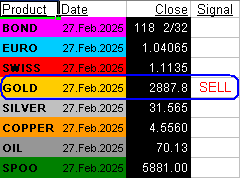
Then this past Thursday (per our daily Prescient Commentary) came Gold’s “Baby Blues” of trend consistency at long last breaking down below their +80% axis (as we’ll later see), which is key in having generated this signal in the end-of-day work spree:
“The obvious question then is, mmb?”
Squire, “How low is low?” Thus here we go: should the present selling become more substantive from the current 2867 level, ‘twould be reasonable to find price reach down into the 2703-2641 zone. To be sure: we still expect Golden Goal Two of “milestone” 3000 to eventually trade, directly or indirectly en route to Golden Goal Three of 3262 as our forecast high for this year. But as we’ve herein reminded since New Year (Gold then 2639), the road to 3262 can quite fairly pass through the lower 2500s. Is that to where this down run is heading? Nobody knows. But ’tis better to get the year’s low place before the high.
And as we been emphasizing, a wayward wrench dropped into the Gold works is inflation. Recall our title from two missives ago included the phrase “Fed’s Next Hike”. Apparently “hike” is not an allowable utterance at large. Rather, press musings oscillate between “cut” and “pause”, with a lean of late toward the latter. This results from their not implementing math. Most notably came yesterday’s “Fed-favoured” inflation report for January’s Personal Consumption Expenditures. The headline number — rather than easing — remained steady at +0.3% whilst the core number’s pace increased from +0.2% to +0.3%. Here thus is our inflation summary for January:
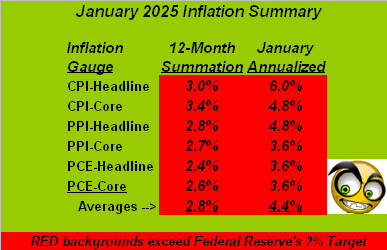
No, thy eyes do not thee deceive. Across the six measures, January’s average annualized inflation pace was +4.4%, more than double the +2.0% ultimately desired by the Federal Open Market Committee, nearly double December’s +2.6% rate, and the most since February a year ago. But absent the use of mathematics, the once mighty Barron’s (which in recent years we’ve designated as a “children’s pool”) ran yesterday with “Inflation Eased…” Seriously. No wonder “The Dow” (that Index at which our parents used to look) gained +601 points.
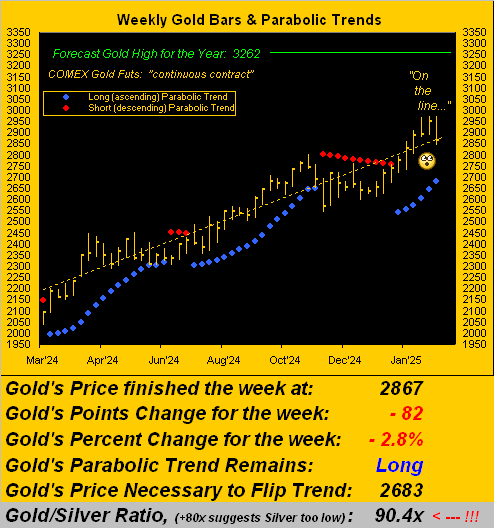
So with the inflation scare in the air, Gold duly dropped as it needed to so do anyway, price as below shown arriving smack on the ascending regression trendline from one year ago-to-date per the weekly bars. Note the parabolic’s flip to Short price is now 2683, which is quite centered in our aforementioned “how low is low” 2703-2641 zone. Too, the Gold/Silver ratio is back above 90x, the white metal retreating more swiftly than the yellow metal:
Lower Gold to be sure, but ’tis not to be distressed. For with two months of 2025 now in the books, we go to our BEGOS Markets Standings year-to-date to again find the Metals Triumvirate leading the whole pack, Copper now atop the stack +13.4% as the red, yellow and white metals dominate the podium:
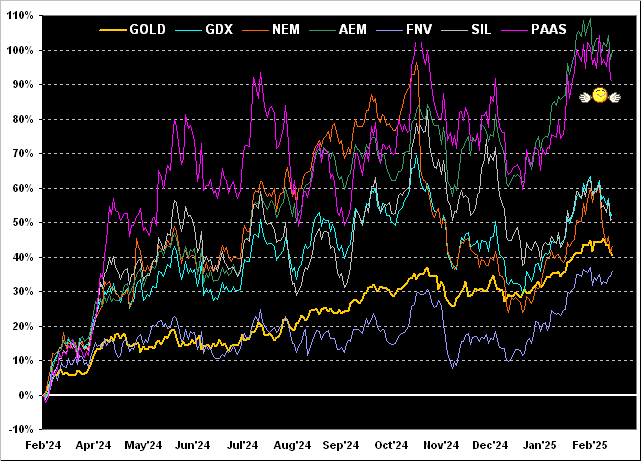
And with further specificity to the precious metals, here we’ve the year ago-to-date percentage tracks of Gold along with key of its equities kin, therein finding Agnico Eagle Mines (AEM) having doubled at +100%, followed closely by Pan American Silver (PAAS) +91%, and then the VanEck Vectors Gold Miners exchange-traded fund (GDX) +53%, the Global X Silver Miners exchange-traded fund (SIL) +51%, Newmont (NEM) +43%, Gold itself +40%, the bunch rounding out with Franco-Nevada (FNV) +36%. ‘Tis about as good as it gets, even as near-term price decline has set in:
Hardly in decline since Halloween is the Economic Barometer, instead sporting on balance the mildest of rises. ‘Course as we’ve pointed out across some 27 years of maintaining the Baro, increasing inflation works as a positive influence as it raises the nominal values of many-a-metric. Either way for this past week’s 11 incoming metrics, five bettered their prior period, five were worse, and steady was the first revision to Q4’s Gross Domestic Product at an annualized +2.3% pace:
As for yesterday’s S&P 500 big post-White House brawl rally, we eye it as a “dead cat bounce” given the significant deterioration of late in the Index’s Moneyflow regressed into S&P points. By the website’s S&P Moneyflow page, the Index per this leading indicator “ought be” some 180-to-230 points lower than currently ’tis (5955). Still, a tip of the cap to just concluded Q4 Earnings Season: therein, 454 S&P 500 constituents reported, 69% of them bettering their bottom lines from a year ago, which across the past 31 reporting quarters has averaged 66%. But as we point out ad nauseam, the overall level of earnings remains terribly weak given the price of the Index, the “live” price/earnings ratio of the S&P now 43.3x. So stay suspect when it comes to stocks.
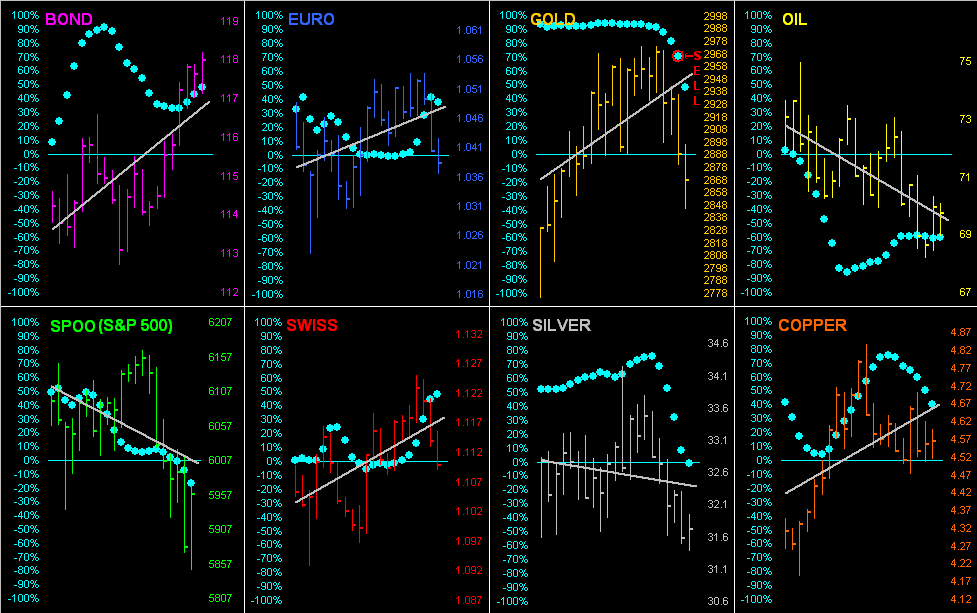
Not suspect a wit (per the “SELL” in the table earlier displayed) is the inevitable cascade in Gold’s “Baby Blues”, the red-encircled dot below confirming such signal. So as is our month-end wont, here we go ’round the horn for all eight BEGOS components across the past 21 trading days (one month). And you know the jingle: “Follow the blues, instead of the news, else lose yer shoes”:
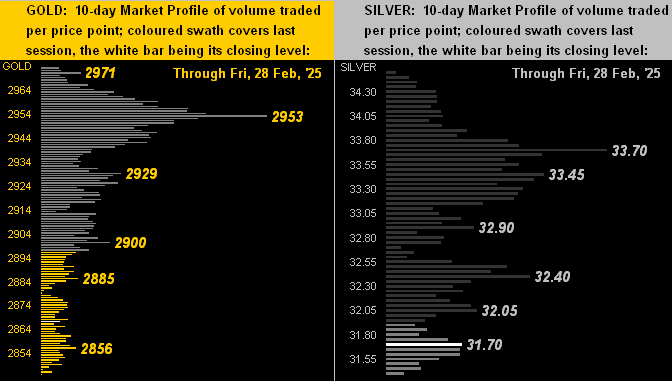
Next we’ve the 10-day Market Profiles for Gold on the left and for Silver on the right. Clearly at 2867, Gold is better than -100 points below its recent All-Time High (2974 this past Monday), whilst Silver has traveled from the 34s back to the 31s. Notable volume-dominant prices are as labeled:
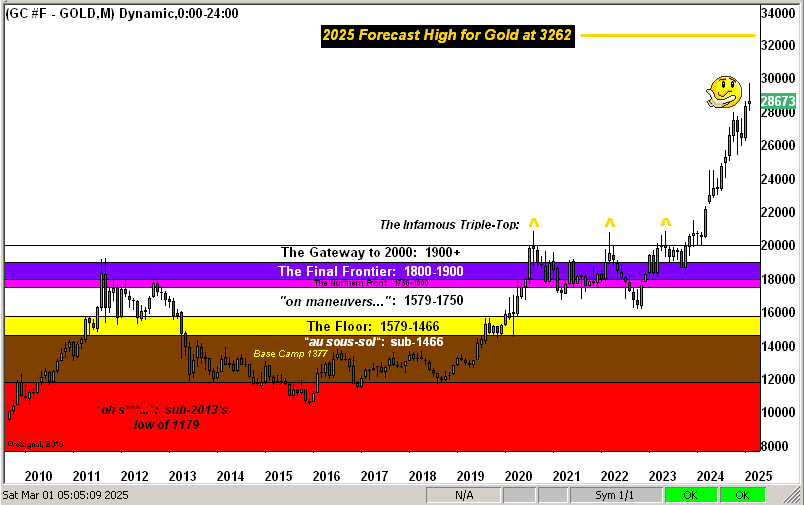
And with February now in the books, ’tis once again Gold Structure time by the month across some 16 calendar years. Take note of “The Infamous Triple-Top” whereby each candle closed well below its respective month’s high, price then declining over the ensuing months: our rightmost candle now for February has the same characteristic. The good news “as ever” is Gold by currency debasement remains very cheap indeed. Nonetheless, here’s the graphic:
So thus far for 2025 we’ve two months down (both net-net up for Gold) and ten to go. As noted, in the year’s balance remain Golden Goal Two of “milestone” 3000 and our projected Golden Goal Three of 3262 for the high. Yet ahead of such ascent we’ve this current descent, for which as stated we are thankful given major markets are not unidirectional. However, one thing to watch is a stirring of geo-political jitters which as you regular readers know can quickly send Gold higher — but generally just briefly — before returning down from whence it came. Either way, in the words of The Gold Update’s first ever reader away back in 2009 (JGS): “We’ll watch it together.”
So be a cool cat and stay with your Gold!
Cheers!
…m…
www.TheGoldUpdate.com
www.deMeadville.com
and now on “X”: @deMeadvillePro
********
share
share
share
share
share

Mark Mead Baillie has had an extensive business career beginning in banking and financial services for two years with Banque Nationale de Paris to corporate research for three years at Barclays Bank and then for six years as an analyst and corporate lender with Société Générale.
For the last 22 years he has expanded his financial expertise by creating his own financial services company, de Meadville International, which comprehensively follows his BEGOS complex of markets (Bond/Euro/Gold/Oil/S&P) and the trading of the futures therein. He is recognized within the financial community of demonstrating creative technical skills that surpass industry standards toward making highly informed market assessments and his work is featured in Merrill Lynch Wealth Management client presentations. He has adapted such skills into becoming the popular author each week of the prolific “The Gold Update” and is known in the financial website community as “mmb” and “deMeadville”.
Mr. Baillie holds a BS in Business from the University of Southern California and an MBA in Finance from Golden Gate University.