Who Needs Anything Else for Trading Gold, When There’s RSI?
You do. At least if you want to catch the really big and really profitable moves, and not only the small ones. Let me explain.
Rethinking RSI's Role in Gold Trading
The accuracy of the RSI (Relative Strength Index) for gold and mining stocks is quite notable. In fact, it’s more than that – it’s a very good indicator for both related markets. Some might even say that once you pay attention to RSI, other techniques of analyzing the market become obsolete.
Is it really true, though? The opening part of today’s analysis seems to suggest otherwise. Let’s check.
Now, before I proceed with featuring the gold chart, I’d like to emphasize that I will not be conducting the full analysis of RSI here. I will focus on the buy signals and not on the sell ones. Gold has been declining in recent days, so the question that many investors will soon be asking is when gold is going to finally bottom.
While I’m not questioning RSI’s usefulness in general, I am questioning it in case of bigger price moves, in particular in case of bigger declines. The biggest declines of the past decades took place in 2008 and 2013. Let’s see how well one would fare if they relied only on the RSI as a buying indication (with RSI moving below 30 being the signal).
During the 2013 decline itself, we saw this important buy signal twice – in February and in April. And what happened then? Gold kept on declining – it was not a buy signal at all. In particular, the April buy signal was exceptionally misleading.
Assessing RSI's Efficacy
In the case of the 2012 performance since May, gold-based RSI flashed its buy signal three times, and it was a buy signal in two cases, and it was followed by a short-term decline in the remaining case.
Overall, RSI wasn’t really useful in the 2012-2013 period. In particular, the fact that it would have made one buy right before the slide makes it a poor candidate to time the really critical market bottoms. At least when the RSI is based on the daily prices, as that’s what we’re considering here.
Was the accuracy better in 2008?
This time, RSI was able to pinpoint the final bottom in October 2008, but it failed to pinpoint the bottom in August and September.
In particular, the very first buy signal seen in August is disappointing.
Why? Because if people buy right after the first buy signal, they are unlikely to sell later in order to buy-back at even lower prices (being convinced that the bottom is already in). Not to mention shorting and profiting on the decline in this way. So, in a way, the first failed buy signal makes the final buy signal relatively unimportant.
The sad reality was the same in both cases:
In case of big price declines in gold, looking at RSI alone might make one make wrong trading decisions. The same goes for other techniques that focus on short-term price moves.
Consequently, if there are indications that what’s about to happen is not just a regular short-term thing but actually a big, medium-term price swing, then one would be much better off focusing on many more indications than just the RSI.
Now, are we in this kind of situation in gold?
Of course we are!
Last week’s enormous reversal and invalidation of the move to new all-time highs was a breathtaking event of extreme importance. Those kinds of indications are unlikely to be followed by small, unimportant declines. No. Something bigger is looming. And in this case, one needs an analysis that is more in-depth than just a single indicator or two of them.
Gold has just verified its breakdown below the rising, red support line by moving back up and then down again. And it was right after gold invalidated its attempt to move to new all-time highs.
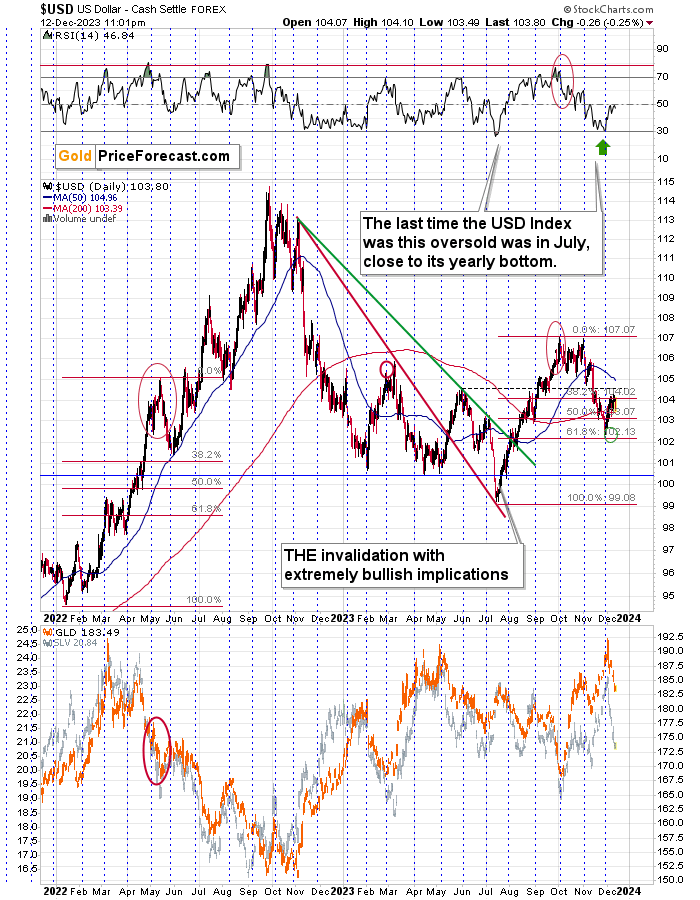
The above happened while the USD Index moved a bit lower! If gold wasn’t strong enough to invalidate the breakdown with USD’s help, then it’s clear that gold really wants to decline further.
And while gold declines more, RSI at 30 may or may not help to pinpoint the next buying opportunity.
Thank you for reading. I hope you enjoyed today’s free article. Its full version - today’s Gold Trading Alert -is much bigger than what you read above, and it includes not only the initial downside target for the GDXJ (level from which juniors could rebound) but the entire price path that the GDXJ is likely to take (with specific target areas (for declines and rallies). And it can be yours with a 10% discount for the first paid-for period (even in the case of yearly subscriptions). I encourage you to subscribe and read those premium details today. Use the coupon code GOLD10 to get 10% OFF on your first paid-for period, applicable even for yearly subscriptions!
Sincerely,
Przemyslaw K. Radomski, CFA
********


 Przemyslaw Radomski,


