Gold, Silver, Copper Analysis: Navigating Through Global Economic Developments and Monetary Strategies
NEW YORK (November 24) Following a week of significant economic developments, precious metal prices are responding to a mix of market factors. October’s inflation figures led to speculation about a possible interest rate cut by March 2024, affecting investor sentiment. The release of positive U.S. job growth and consumer sentiment data has strengthened the dollar, typically inversely related to gold prices.
The FOMC minutes from November 21 suggested a continued high interest rate strategy to combat inflation, contrasting with market expectations of rate reductions, causing uncertainty in the gold market. Gold’s status as a stable reserve asset and a hedge against inflation is reinforced by substantial investments from central banks.
Presently, amidst these fluctuating economic signals and central bank policies, Comex Gold’s price has shown little movement in Asian trading hours. Investors remain cautious, weighing the implications of global macroeconomic trends and monetary policies on the future prices of precious metals like gold, silver, and copper.
Gold Prices Forecast

GOLD – Chart
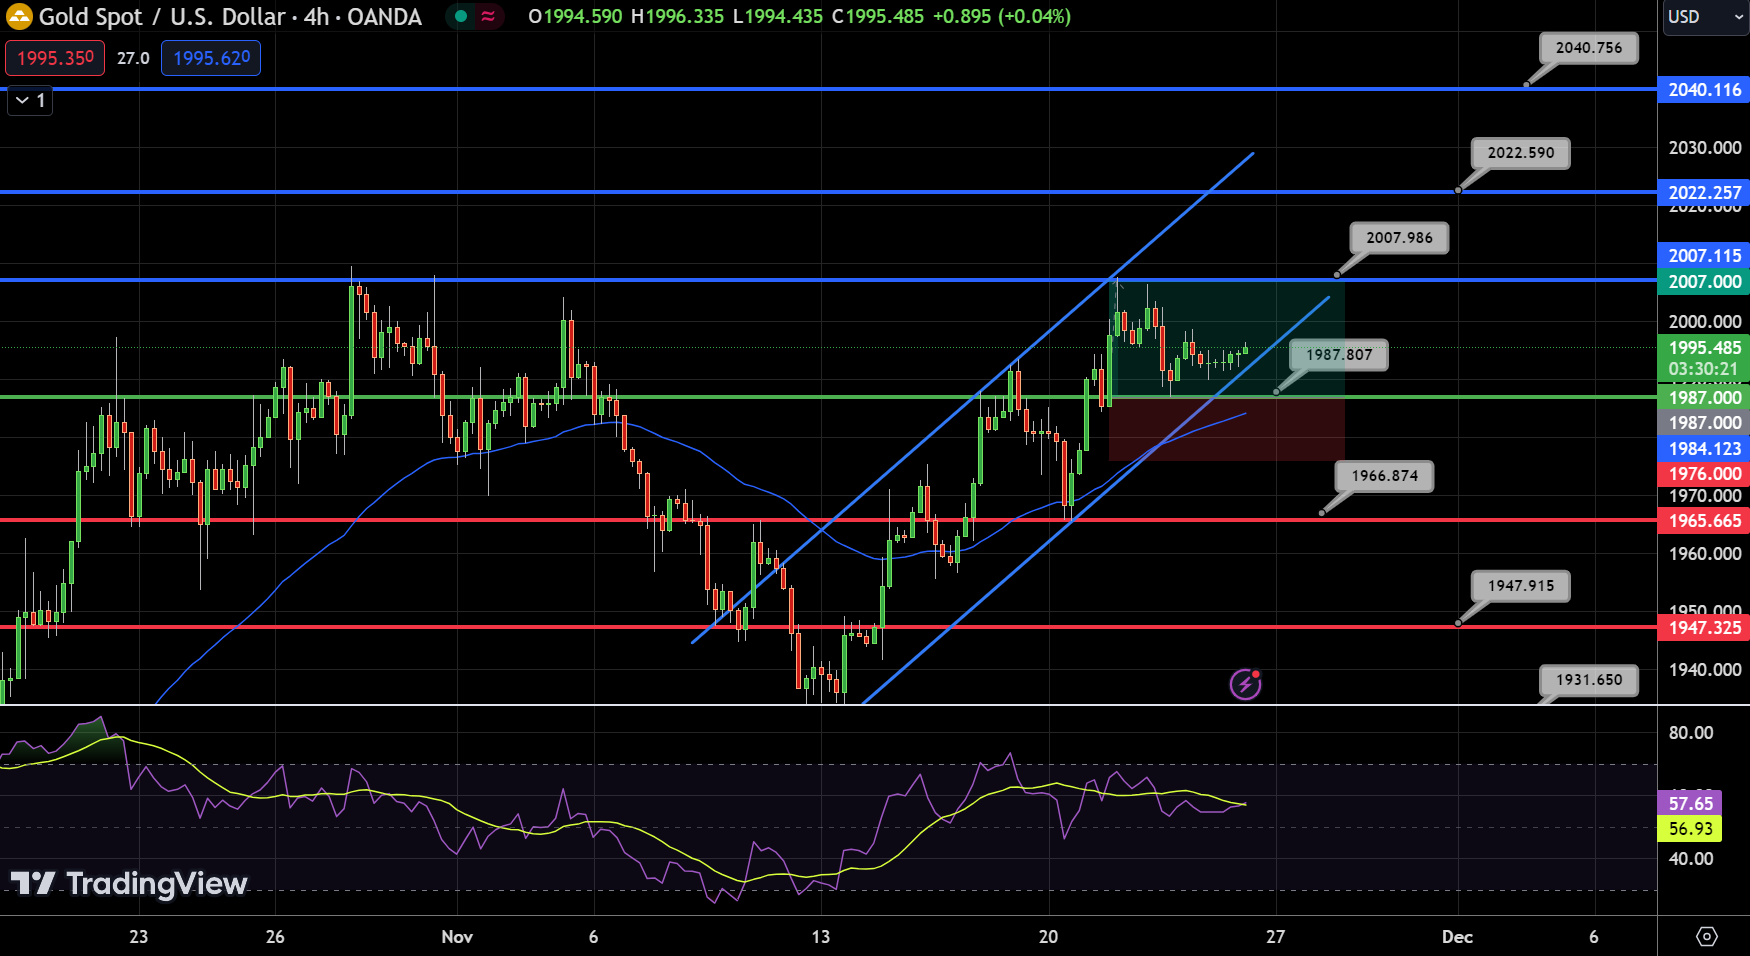
In today’s trading session, Gold has exhibited a modest uptick, currently priced at $1995, reflecting a 0.12% increase over the past 24 hours. The 4-hour chart offers a detailed perspective, indicating pivotal movements around the $1,988 mark.
Notably, the immediate resistance level looms at $2,008, with subsequent barriers at $2,023 and $2,041. Conversely, the immediate support is established at $1,967, followed by stronger cushions at $1,948 and $1,932.
The Relative Strength Index (RSI) stands at 57, subtly signaling bullish sentiment without veering into overbought territory. Meanwhile, the MACD indicator reveals a divergence of -0.97 from its signal line at 3.388, suggesting a cautious watch on momentum trends. Gold’s trading above its 50-Day Exponential Moving Average (EMA) of $1,984 reinforces a short-term bullish outlook.
Chart analysis reveals a notable pattern, reminiscent of a symmetrical triangle, coupled with a positive candlestick formation. This pattern often predicates a potential bullish breakout, especially when corroborated by current price movements above the 50 EMA and a stable RSI.
In conclusion, the overall trend for Gold remains bullish as long as it sustains above the pivot point of $1,988. The short-term forecast anticipates a test of the $2,008 resistance level, contingent on the asset’s momentum and prevailing market sentiments.
Advertisement
Silver Prices Forecast

Silver – Chart
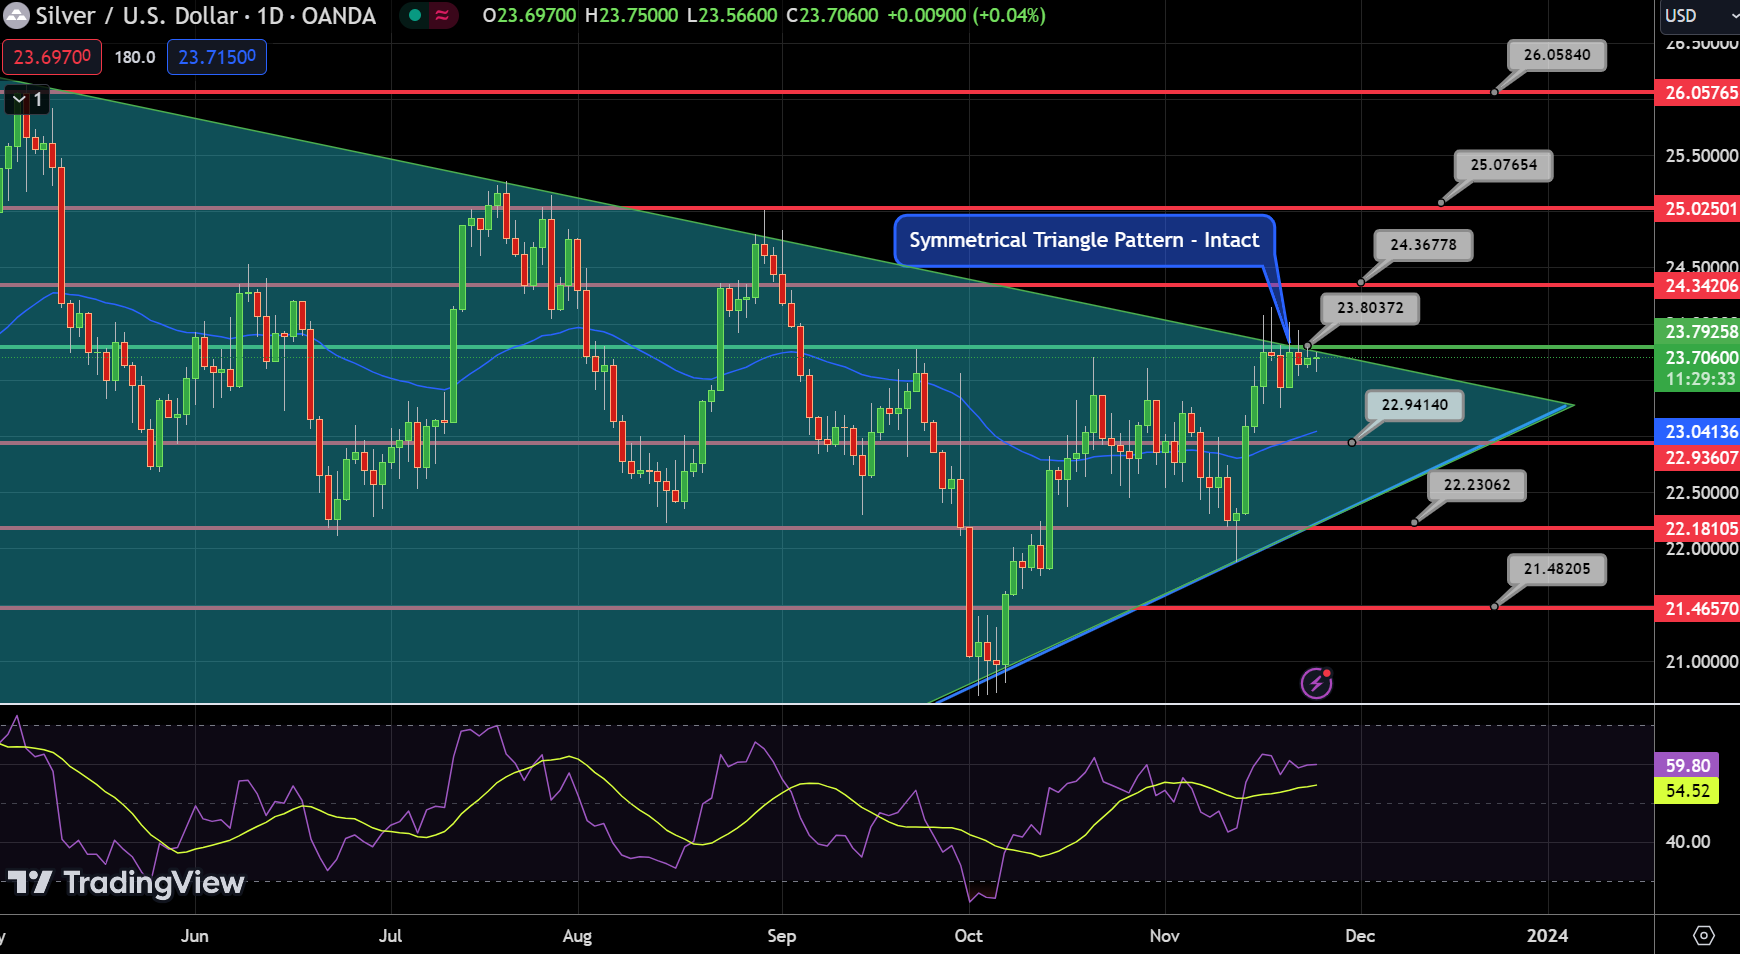
Silver’s market activity today showcases a slight decline, trading at $23.70, down by 0.24%. Analyzing the 4-hour chart, the metal currently hovers below its pivot point of $23.80. Resistance levels are observed at $24.37, $25.08, and a more significant barrier at $26.06. On the flip side, support is found at $22.94, with additional levels at $22.23 and $21.48.
The Relative Strength Index (RSI) stands at 59, indicating a mild bullish sentiment but not tipping into overbought territory. The MACD shows a narrow gap, with a current value of -0.018 against a signal line of 0.043, suggesting a potential shift in momentum. Silver’s price is marginally above its 50-Day Exponential Moving Average (EMA) of $23.51, implying a tentative bullish inclination in the short term.
Chart analysis identifies a symmetrical triangle pattern, indicating a potential consolidation phase in the market. This pattern often precedes significant price movements, implying a possible breakout.
Conclusively, the trend for Silver seems to lean towards bearish as long as it remains below the $23.80 threshold. The short-term forecast anticipates a potential test of the immediate resistance level at $24.37, dependent on the unfolding market dynamics and the influence of external economic factors.
Investors and traders should stay vigilant, as the current chart patterns and technical indicators suggest a critical juncture in Silver’s price trajectory.
Copper Prices Forecast

Copper – Chart
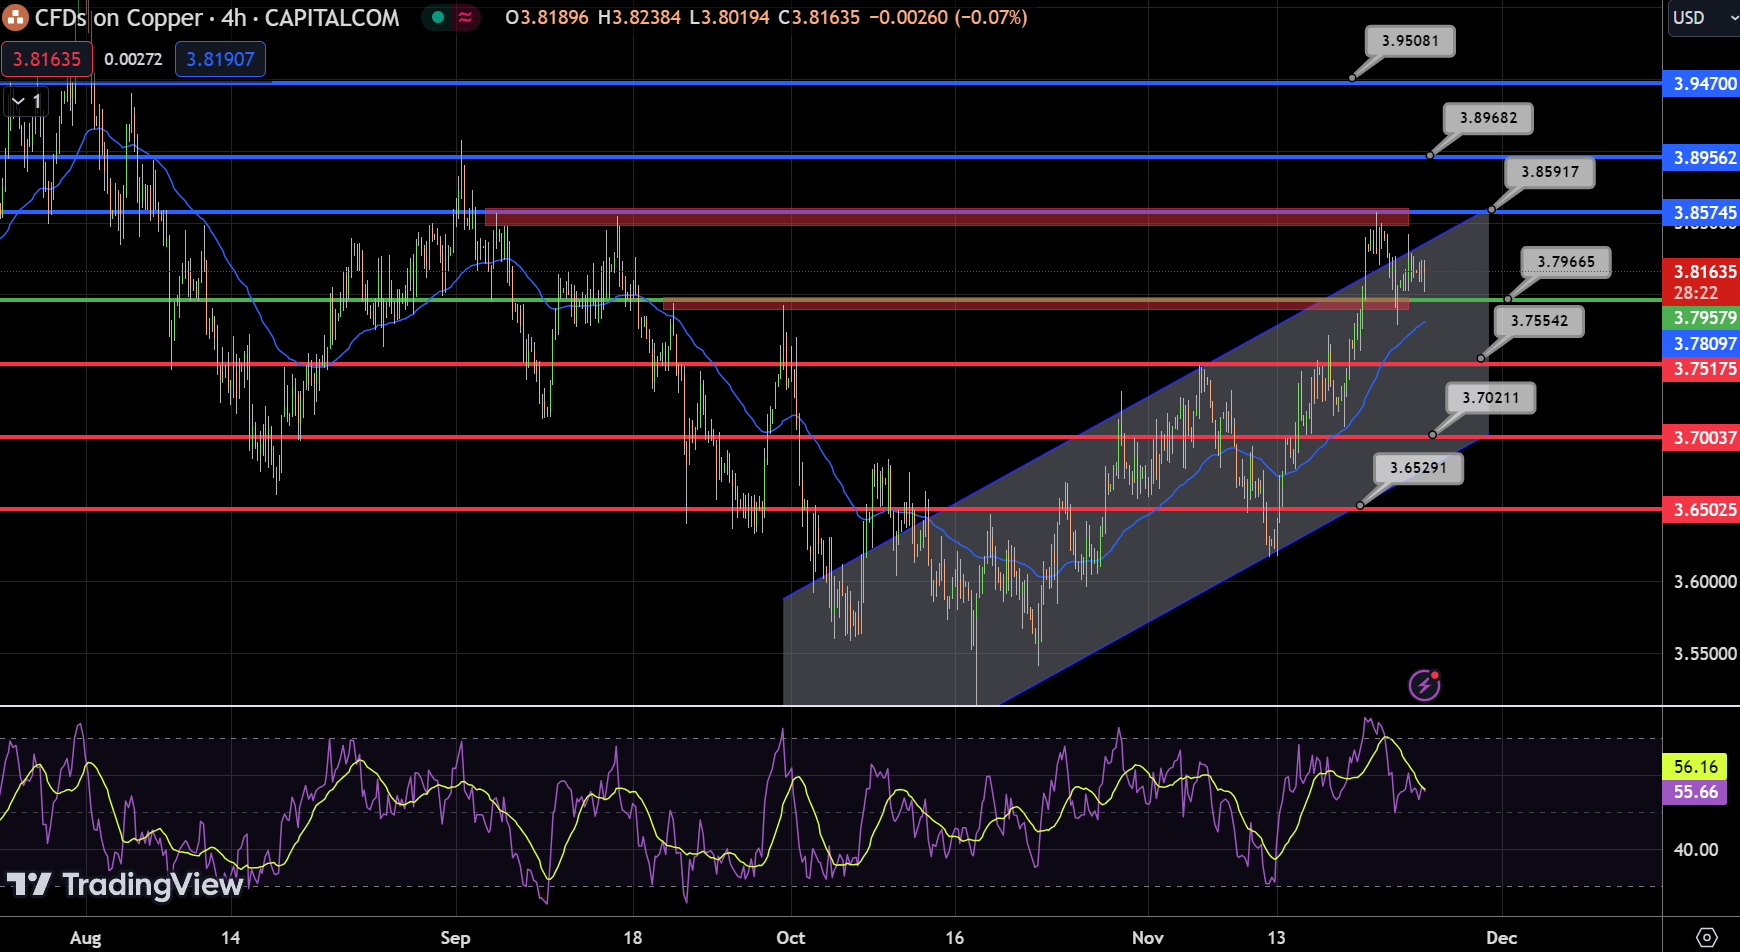
Copper’s trading session on November 24th displays a subtle positive movement, with the current price at $3.82, marking a 0.12% increase. The 4-hour chart analysis shows Copper balancing slightly above its pivot point of $3.80.
Key resistance levels are identified at $3.86, $3.90, and a higher threshold at $3.95. Support, meanwhile, is established at $3.76, with further levels at $3.70 and $3.65.
The Relative Strength Index (RSI) stands at 55, indicating a mild bullish sentiment, but not strongly overbought. The MACD presents a slight negative divergence at -0.0034 compared to its signal line at 0.0099, suggesting cautious observation of potential momentum shifts.
Copper trades just above its 50-Day Exponential Moving Average (EMA) of $3.78, hinting at a short-term bullish trend. The chart shows an upward channel pattern, typically indicative of a continuing bullish trend, provided the price remains within this channel.
Overall, Copper’s trend appears to be bullish as long as it sustains above the $3.80 mark. In the short term, there’s an expectation for Copper to challenge the immediate resistance at $3.86, with further potential to test higher levels, contingent on market dynamics and emerging economic indicators.
FXEmpire


