Oil: Lubrication For Gold Stocks Rally
Gold is ending the year on a solid note. The bears promised that 2014 would be a horrible year for gold. Many bank economists predicted “double digit declines.”
None of their shrill predictions have come to pass. That’s because the gold bears overestimated supply from the West, and demand from China and India.
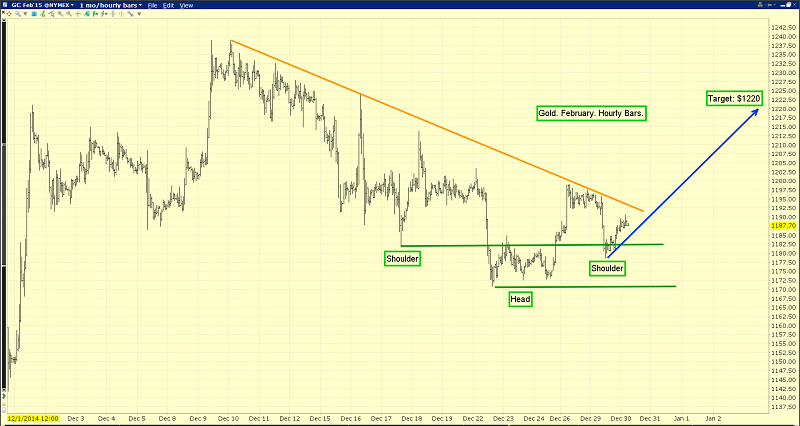
That’s the hourly bars chart for gold. I believe there is now an inverse head and shoulders bottom in play, and the short term price target of that pattern is the $1220 area.
Early yesterday morning, I told my subscribers that I expected gold would decline to the $1180 area to form the right shoulder of the pattern, and rally from there during the night.
That’s what happened. Regardless, gold price enthusiasts should understand that chart and cycle targets are not financial guarantees. They are indications of what is possible and likely.
As the year 2014 ends and 2015 begins, gold is postured quite bullishly, from both a fundamental and technical standpoint.
That’s the daily gold chart. The 14,7,7 Stochastics oscillator is now in an area where rallies of $50 - $150 in the price of gold often occur.

China officially imported almost 100 tons of gold in November, and Hong Kong imported about 50 tons.
As Reuters notes, direct imports into the Chinese mainland from countries other than Hong Kong are not revealed by China. The total tonnage imported into China and Hong Kong during November was likely somewhat higher than 150 tons, but even if they imported no gold directly at all, the demand is excellent.
India also officially imported about 150 tons in November. Clearly, Chindian demand is once again robust, and growing!
As the centres of gold price discovery move from London and New York to Shanghai and Dubai, the price action should mainly revolve around the love trade (gold jewellery).
Until 2014 began, the fear trade (Western debt and the outrageous behaviour of government and banks) was the main mechanism of gold price discovery. In my professional opinion, gold price volatility will diminish significantly as the love trade overshadows the fear trade.
The “shock and awe” growth of the Indian and Chinese economies is relentless. That means the growing dominance of the love trade on the global gold price discovery stage, is probably best described as a “clock that can’t be turned back”.
As terrible as the gold bears were at predicting the price of gold in 2014, if they keep failing to study the Chindian love trade for gold in meticulous detail, their price projections will go much more awry in 2015, than they did in 2014.
Gold stocks are prime beneficiaries of the Chindian gold bull era. That’s the GDX daily chart, and it suggests that gold stocks could begin the New Year with a solid rally.
A “textbook” double bottom pattern is in play. These patterns tend to be quite reliable.
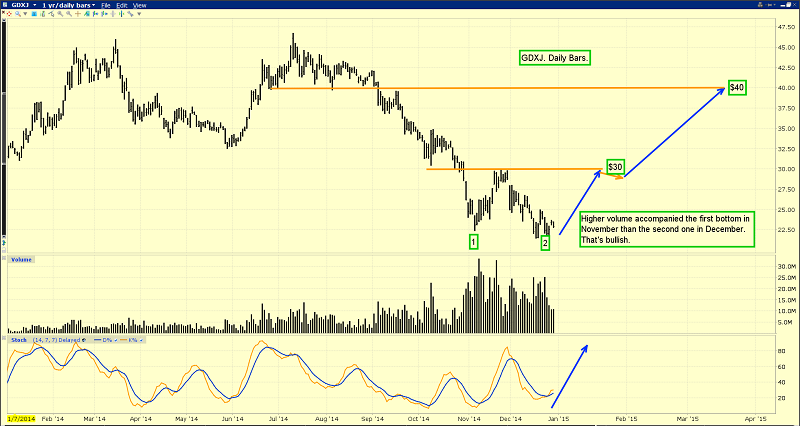
This GDXJ chart is very similar to the GDX chart. The double bottom pattern suggests that GDXJ could rally to the $40 area in early 2015.
Also, GDXJ has been restructured. It now holds more producing gold companies, and that may reduce some of the volatility it experienced in the past.
Silver looks even more bullish than gold does, and I’ve recently swapped a modest amount of my gold bullion for silver.
There’s a nice inverse head and shoulders bottom in play on this daily silver chart.
Some individual silver stocks have the same pattern, and they have already staged strong volume-based breakouts to the upside. The stocks tend to lead silver, and they are supporting my thesis that silver itself is poised for a great rally early in 2015. My short term price target is $19.
That’s the hourly bars chart for oil. I have a $49 short term target for oil. The outlook for oil is grim, both in the short term and the long term.
In the short term, supply is overwhelming demand, and oil company earnings are suffering. In the long term, alternative energy is likely to reduce oil’s function to that of a useful lubricant, from the key fuel that it is now. In the coming decades, I expect the price of oil to ultimately return to pre-1973 levels.
Gold mining companies are entering 2015 with robust demand from China and India, and with a very stable outlook for fuel costs. This situation should entice substantial numbers of value-oriented fund managers into the sector, throughout the year!
********
Special Offer For Gold-Eagle Readers: Please send me an Email to [email protected] and I’ll send you my free “Japanese Yen, Gold, & Silver!” report. A key indicator suggests the US dollar may be be about to suffer a stunning collapse against the yen, and ignite a Happy New Year rally in gold and silver. I’ll show you my key trigger numbers, and how I’m playing the action!
Stewart Thomson
Graceland Updates
Note: We are privacy oriented. We accept cheques. And credit cards thru PayPal only on our website. For your protection. We don’t see your credit card information. Only PayPal does. They pay us. Minus their fee. PayPal is a highly reputable company. Owned by Ebay. With about 160 million accounts worldwide.
Email: [email protected]
Rate Sheet (us funds):
Lifetime: $799
2yr: $269 (over 500 issues)
1yr: $169 (over 250 issues)
6 mths: $99 (over 125 issues)
To pay by cheque, make cheque payable to “Stewart Thomson”
Mail to:
Stewart Thomson / 1276 Lakeview Drive / Oakville, Ontario L6H 2M8 Canada
Stewart Thomson is a retired Merrill Lynch broker. Stewart writes the Graceland Updates daily between 4am-7am. They are sent out around 8am-9am. The newsletter is attractively priced and the format is a unique numbered point form. Giving clarity of each point and saving valuable reading time.
Risks, Disclaimers, Legal
Stewart Thomson is no longer an investment advisor. The information provided by Stewart and Graceland Updates is for general information purposes only. Before taking any action on any investment, it is imperative that you consult with multiple properly licensed, experienced and qualifed investment advisors and get numerous opinions before taking any action. Your minimum risk on any investment in the world is: 100% loss of all your money. You may be taking or preparing to take leveraged positions in investments and not know it, exposing yourself to unlimited risks. This is highly concerning if you are an investor in any derivatives products. There is an approx $700 trillion OTC Derivatives Iceberg with a tiny portion written off officially. The bottom line:
Are You Prepared?


 Stewart Thomson is president of Graceland Investment Management (Cayman) Ltd. Stewart was a very good English literature student, which helped him develop a unique way of communicating his investment ideas. He developed the “PGEN”, which is a unique capital allocation program. It is designed to allow investors of any size to mimic the action of the banks. Stewart owns GU Trader, which is a unique gold futures/ETF trading service, which closes out all trades by 5pm each day. High net worth individuals around the world follow Stewart on a daily basis. Website:


