Gold Market Update
In the last update posted on the 17th it was predicted that gold would stage a rally to alleviate the oversold condition that existed at that time, and that this rally would take it about $595 before it reacted back again. Today gold attained $594.15 intraday. However, this rally was expected to occur against the backdrop of a rally in commodities generally, which has not occurred but now looks set to occur. If it does gold is well placed here to rapidly gain traction in coming days, and the strong performance by gold stocks today points to a stronger advance in gold in the near future. Nevertheless, the risk of it suddenly going into reverse again if commodities generally do not rally as expected should not be discounted.

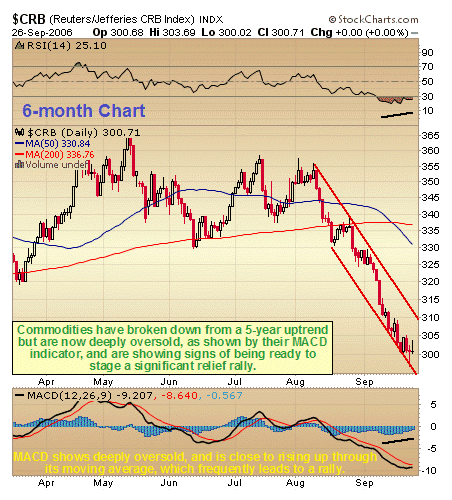
On the 6-month chart we can see the potential small base that has formed just beneath the 200-day moving average. We had earlier expected this, but also expected it to go into renewed decline from here, despite the MACD indicator shown at the bottom of the chart having risen up through its moving average, and the MACD histogram having moved up above the zero line, developments that frequently precede a stronger rally. However, if we now look at the 6-month chart for the Commodities index we see that Commodities have still not recovered at all from their deeply oversold position, but yet are looking increasingly likely to stage a significant relief rally soon, as the MACD is very close to rising up through it moving average from a very low level and the MACD histogram is moving up towards the zero line.

It is thus clear that if we see a significant snapback rally by commodities generally, gold is well placed to break above the resistance at $600 and stage a significant rally from here. As described in the Big Picture article, however, we should not lose sight of the fact that commodities have suffered a major breakdown, and after a relief rally are likely to go into renewed decline. This should be kept in mind by traders who are long gold going forward.
Silver Market Update
Clive Maund
In the last update posted on the 17th it was predicted that silver would stage a rally to alleviate the oversold condition that existed at that time, and that this rally would take it about $11.60 before it reacted back again. Today silver attained $11.49 intraday. However, this rally was expected to occur against the backdrop of a rally in commodities generally, which has not occurred but now looks set to occur. If it does silver is well placed here to rapidly gain traction in coming days, and the strong performance by Precious Metals stocks today points to a stronger advance in silver in the near future. Nevertheless, the risk of it suddenly going into reverse again if commodities generally do not rally as expected should not be discounted.

On the 6-month chart we can see the potential small base that has formed in the vicinity of the 200-day moving average. We had earlier expected this, but also expected it to go into renewed decline from here, despite the MACD indicator shown at the bottom of the chart having risen up to its moving average, and the MACD histogram having moved up to the zero line, developments that frequently precede a stronger rally. However, if we now look at the 6-month chart for the Commodities index we see that Commodities have still not recovered at all from their deeply oversold position, but yet are looking increasingly likely to stage a significant relief rally soon, as the MACD is very close to rising up through it moving average from a very low level and the MACD histogram is moving up towards the zero line.

It is thus clear that if we see a significant snapback rally by commodities generally, silver is well placed to break above the resistance at $11.75 and stage a significant rally from here. As described in the Big Picture article, however, we should not lose sight of the fact that commodities have suffered a major breakdown, and after a relief rally are likely to go into renewed decline. This should be kept in mind by traders who are long silver going forward.
Most of what is written above is a carbon copy of what has been written for gold, adapted for silver, because the patterns that have formed in both metals in recent weeks are almost identical, and the same arguments apply to them both at this time.
Clive Maund, Diploma Technical Analysis
Kaufbeuren, Germany, 27 September 2006


