Gold Market Update
There are a lot of conflicting opinions being bandied about regarding the outlook for Precious Metals prices, as many readers will no doubt be aware, and when this occurs, it is usually a symptom of a trading range situation.
At a time like this we need to stand back and look at the big picture. We will therefore start by considering the very long-term gold chart that goes way back to the early 1970’s, and thus includes two bull markets, the great 70’s bull market and the current one.

On this weekly chart it is clear that if we classify the vertical ascent of the late 70’s as a “Spike”, then the recent runup, which looks tame by comparison, can fairly be described as a “Spikelet”, and when you factor in inflation in the intervening years it is certainly “nothing to write home home about”. In fact gold only really broke out when it crossed the $500 line - where there was substantial resistance arising from the 1983 and 1987 highs. This former resistance is now, of course, a zone of support. The relatively modest nature of the spikelet is emphasized by the MACD indicator, which shows that although an overbought situation developed, it was nowhere near as extreme as that in 1979. Gold has nevertheless stopped for a breather following the peak at about $720, and the big question now is whether what we are seeing now is a healthy consolidation/reaction, or whether it’s all over bar the counting.
The answer to this question is implicit in what was written above about gold still only being $120 or so above the breakout line of a 23-year line of resistance. It seems highly unlikely that, given the significance of this breakout, gold will rise a mere $220 or so before the advance peters out and it goes into reverse, especially factoring in inflation. In addition, the breakout was the product of a giant Cup and Handle base pattern that took 9 years to develop, and it would be unusual for such a large base area to generate such a short-lived advance. However, the situation is complicated rather by the odd behaviour of gold stocks, which have marked out a potential “Head-and-Shoulders” top, which we would probably not take too seriously were it not for the fact that many gold stocks exhibited decidedly bearish volume patterns on the recent severe drop.
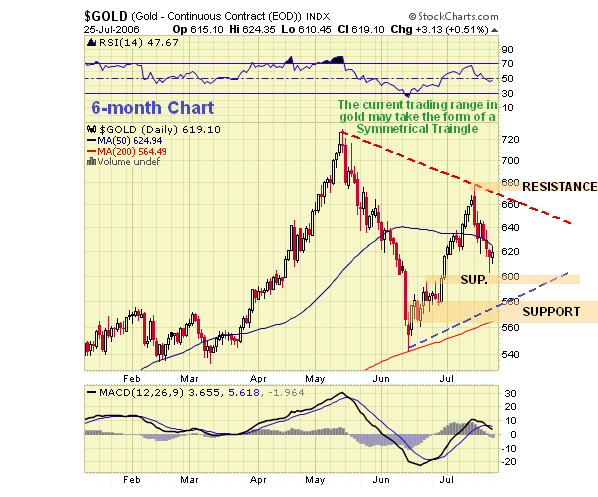
We therefore conclude, pending additional evidence one way or the other, that gold is currently in a trading range situation. The effective boundaries of this range are the strong support in the $560 - $580 area and resistance approaching $680, shown on the 6-month chart, and it should be noted that there is significant support at $600. While gold remains within these parameters, it will be considered to be range bound. Traders can reverse position at these levels with a close stop to restrict losses in the event of the price crashing them.

Silver Market Update
Clive Maund
The arguments pertaining to gold apply to a large extent to silver too, where this year’s sharp runup towards $15 certainly only ranks as a “Spikelet” in comparison to the monstrous “Hunt Brothers” superspike of 1979, which had opportunists everywhere rushing to the furnace with Aunt Maud’s treasured silver heirlooms to take advantage of the price rocketing towards $40, which, inflation adjusted, was vastly in excess of the recent peak.

Our long-term chart only goes back to 1994, but keeping the 1979 - 1980 peak in mind, we can readily see that, inflation adjusted, the recent spikelet was a comparatively modest affair. After the peak, a heavy reaction set in, and now, like gold, a trading range appears to be developing. Silver exhibits a fine example of a Pan & Handle base, that formed between late 2000 and about August of last year. These formations are very bullish and good examples of the ballistic advances that frequently follow the completion of such patterns are provided by the charts of ECU Silver ECU.V, Pioneer Drilling PDC and Tanzanian Royalty TRE (the former Tan Range). This is a weekly chart and we can see that, on an intermediate basis, the overbought condition has neutralised, as shown by the MACD indicator at the bottom of the chart. Silver truly broke out from a long, dull multi-year period of sideways trading only late last year, when it broke clear above the $8 level, which level is now a strong and important support level. Thus, the spikelet is “small potatoes” compared to what could eventuate in the future.

On the 6-month chart we can see that the price is being pincered between its rising 200-day moving average, and its now steeply falling 50-day moving average. This is a situation that is expected to generate a sharp move soon. It could break either way, but consideration of the charts of large silver stocks suggests that the break will probably be to the upside. Note, however, that although we may see a sharp move soon, this is unlikely to signal an end to the trading range, which is defined by support towards $9.50 and resistance towards $11.80.
Clive Maund, Diploma Technical Analysis
Kaufbeuren, Germany, 27 July 2006


