Debt Cycles And The Gold Price
Summary
-
Is the current global economic growth sustainable?
-
Which phase of the debt cycle are we in?
-
What does it mean for the gold market?
There is a range of factors which drive the Kondratiev waves. Following Schumpeter, we have focused so far on technological innovations. However, debt cycles are also a key. What are they?
The debt cycles are comprised of alternate leveraging and deleveraging of debt. The former occurs when people incur debt, increasing the debt-to-income ratio, or the debt-to-assets ratio. The latter is the opposite, so it means paying back the debts, which leads to the decrease in the amount of debt relative to wages or assets.
Thanks to leveraging, economic units can increase their spending and magnify profits when the returns from the asset more than offset the costs of borrowing. This is why increasing debt load may temporarily boost economic growth. However, at some point, debt servicing costs become too much relative to income. When the debt level reaches a saturation point, the deleveraging begins, and GDP growth slows down.
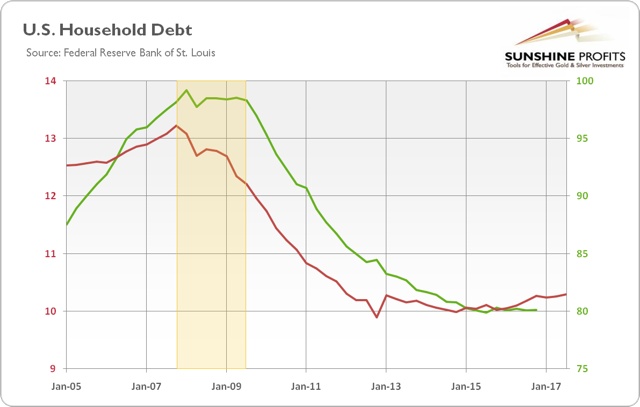
The best example may be the Great Recession. Prior to the financial crisis, U.S. households had been financing spending more and more by credit, boosting their leverage. Another mortgage? Why not, the house prices have to rise forever, right? We all know how the credit bonanza ended. When the home prices finally fell, while debt interest rates went higher, borrowers weren’t able to cover their debt servicing costs any longer. The households went underwater and couldn’t roll over their debts. The economy started to deleverage, as one can see in the chart below. It was a healthy reset, but economic growth slowed down, as households had to tighten their belts.
Chart 1: U.S. household debt relative to GDP (green line, right axis, as %) and U.S. household debt service payments relative to disposable personal income (red line, left axis, as %) from 2005 to 2016/2017 (the yellow rectangle marks the recession).
What does it all imply for the gold market? Well, before we answer this question, let’s relate the debt cycles to the Kondratiev waves. In the autumn phase, there is speculative fever, as economic growth is fueled by debt and anticipation of ever increasing asset prices. We believe that that phase occurred and was ended by the Great Recession. Then, winter came: the stock market crashed and the unemployment rate soared. And – importantly – there was asset price deflation and debt deleveraging (the deflation would have been larger if the central banks didn’t introduce ZIRP and quantitative easing). The interest rates were ultra-low, but didn’t boost the credit expansion, as deleveraging dominated. Households didn’t want to take on new debt, since they had to pay back their previous loans.
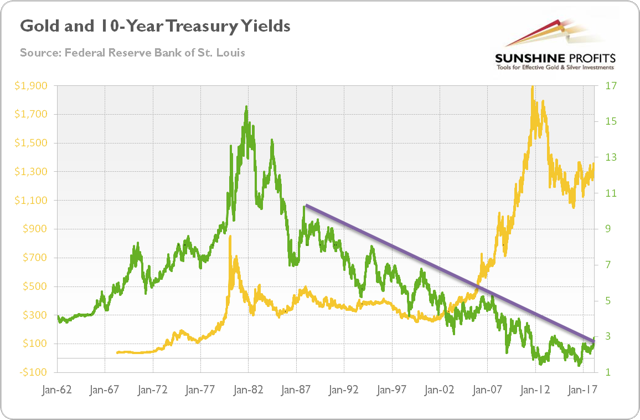
It implies that we enjoy spring right now. There is an economic upswing, inflation is low and interest rates are more or less stable (or used to be stable until recently). Stocks are in a bullish trend, but confidence remains low. However, we can be at the transition point towards summer, as the next technological revolution is approaching. Higher inflation also looms on the horizon. The interest rates are rising as well – just look at the chart below, which displays the 10-year Treasury yields.
Chart 2: Gold prices (yellow line, left axis, London P.M. Fix, in $) and the 10-year Treasury Yields (green line, right axis, in %) from 1962/1968 to 2018.
They peaked in 1981 and have been trending lower for 35 years. Since 2016, interest rates have been on rise, breaking the downward trend only this year. Given that gold shined in the 1970s, when the bond yields were rising, we could see a similar scenario, where inflation and nominal interest rates accelerate.
To be clear: the Kondratiev waves are a controversial concept, not accepted by many academic economists. It shouldn’t be surprising, as there is no agreement about the start and end of each phase. Economists even differ with their opinions on which wave we live in currently! For example, some analysts argue that we are still in the winter phase, as central banks’ unconventional monetary policy prevented full deflation and debt liquidation. Actually, the total global debt soared to a record $233 trillion in the third quarter of 2017. So the worst may be just ahead of us (which actually also would be nice for the precious metals). But, if our reading of macroeconomic factors is correct, the summer phase may be on the horizon. According to its features – mainly rising inflation – gold should glitter then.
However, investors should be aware that it may not happen very soon, as the spring has begun relatively recently, while the uptick in inflation should be constrained by global competitive pressures. It means that sideways trend in the gold market may continue for a while. Even a decline wouldn’t invalidate the above if gold breaks below the previous lows only temporarily. You see, there are no regular cycles actually – economic history rhymes, but doesn’t repeat itself exactly. Hence, investors shouldn’t accept simplistic formulas (especially those developed a very long time ago in different institutional environments), but carefully analyze – as we do – the current macroeconomic context and its implications for the gold market.
*********
Disclosure: I/we have no positions in any stocks mentioned, and no plans to initiate any positions within the next 72 hours.
I wrote this article myself, and it expresses my own opinions. I am not receiving compensation for it. I have no business relationship with any company whose stock is mentioned in this article.


