Case Study: Newmont
A lot of interest has been generated among our subscribers who obviously have different opinions and outlook for this blue chip mining stock, who was the largest until the merger of Barrick and Placerdome. As always, I do not discuss the fundamental aspects of these subjects, I only offer the technical perspective, and whether we have a favorable set up to enter positions.
When looking at individual stocks, I prefer the bottoms up approach, meaning beginning with a short term time frame, and work our way up to the longer term. Because any positions we take, must begin with the shorter term in order to manage risk, then we progress to the longer term to see what potential it has going forward. Many investors make the mistake of doing the opposite, buying into a position based on their long term outlook, and suffer the initial drawdown by ignoring the short term, which may result in a loss, and worse yet, being out of positions and end up chasing the stock. A few round of this and they will swear off the stock for good, missing out on a potentially lucrative investment.

From the daily time frame, we have a fresh buy signal. Our specific instruction is to buy NEM on a reversal day with stops at the trendline support, risking under 3%. Immediate upside target is recent high of $62 which translates into nearly 20% return. Risk/reward is better than 1<6, which is excellent in my books.

Looking at the weekly time frame, it is currently on a sell signal. However, prices have found congruent support at rising trendline support, and the 50ema support, which according to our trading model, a major trend continuation buy signal when confirmed. This follows the weekly BSBS from 2005 which was a major buy signal. Our subscribers bought NEM on 11/16 at $44.31 and holding for long term gains. Using the daily buy signal, both traders and investors with new money can buy now with instructions above.

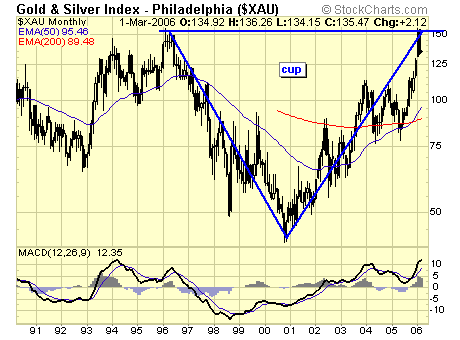
From the long term perspective, NEM has finally reached resistance at the $60 level, in the process of completing a multi year "cup with handle" pattern, which has very bullish implications upon a breakout. And NEM is not alone, it is joining some very good company….

The $XAU is on the same journey…..

and the $GDM which has already broken out in Dec 2005.
Summary
NEM has been lagging badly during the recent correction and subsequent recovery, and has partly contributed to the under performance of the $HUI and $XAU, which should be corrected once the current technical structure has the time to resolve itself. Of course, from current indications, the resolution should be bullish, and the risk/reward is very favorable for both traders and investors, to either establish or adding to positions. NEM can be purchased in Canada under the symbol of NMC in Toronto.
Jack Chan at www.traderscorporation.com
5 April 2006


