A Week Of Stock Market Turmoil With More To Come
Can you believe it? After a week where the Dow Jones saw four days of extreme market volatility (Dow Jones 2% days), and the NYSE saw two days of extreme market breadth (NYSE 70% A-D days), the Dow Jones closed UP 455 points from last week’s close. After all that the Dow Jones in its Bear’s Eye View Chart below is little changed from last week.
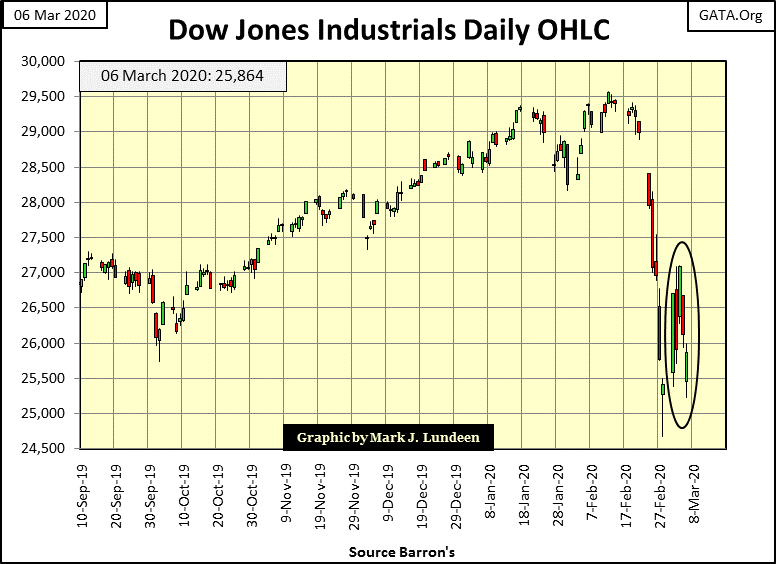
Looking at the Dow Jones in its daily bars (next), it’s very apparent how after Friday, February 21st someone (Mr Bear?) changed the rules. From October 1st to February 21st average daily volatility for the Dow Jones was only 0.50%. In the past two weeks it has leapt to 3.01%. And though the Dow Jones closed up 455 for the week, looking at the chart below one thing comes to my mind – Mr Bear is once again hard at work.
Nothing is less valued than unsolicited advice. But if you value what money you now have in the stock market, whether you’re showing profits or losses, I’d put some distance between your hard earned money and what we’ve seen below since February 21st.
I don’t care should the stock market in the next few weeks once again behave as it did from October to February in the chart below. There are times when the right thing to do in the market is to refuse to expose your retirement funds to it, and this looks to be one of them.
The problem with the early stage of a BIG Bear Market is one of human psychology; they feel so much like the late stage of a BIG Bull Market from where they come from – a safe place to be. In a bull market investors see market declines as buying opportunities. During bull markets this is a very wise market strategy, but in bear markets this is suicide.
The best way to understand the early stages of bear markets is know they are an educational program for investors. Here’s a video of Mr Bear teaching retail bulls the errors of their way during the 2007-09 credit crisis bear market.
https://youtu.be/5TNhS81w4bM?t=84
The scary thing about this week was the Federal Reserve cut its Fed Funds Rate by fifty basis-points (0.5%), and things actually got worse for it. Maybe Fed Chairman Powell should have kept his promise he made just last December where he said no interest rate cuts for 2020:
“The Federal Reserve hit the pause button Wednesday, deciding to leave interest rates unchanged for now and signaling no plans to cut in 2020. President Trump has repeatedly urged the Fed to slash rates, but the central bank says the U.S. economy is in a good place and does not need an extra boost.”
- Heather Long _Dec. 11, 2019 at 2:24 p.m. CST
The Federal Reserve always attempts to talk the market up just prior to a big market meltdown, as Doctor Bernanke did in May 2007 below.
"We do not expect significant spillovers from the subprime market to the rest of the economy or to the financial system."
- Fed Chairman Ben Bernanke, May 17, 2007
Do you want the real inside information on the FOMC? Here it is: they are as clueless of what is actually going on as is main-stream financial media.
That doesn’t mean they don’t have information that you or I don’t have; they do. China currently is undergoing a national quarantine as their response to the coronavirus. That means in our world of “just in time inventory”, factories shutting down in China will ultimately also shut down production lines in the United States and elsewhere.
For a world as heavily indebted as is ours, the debt markets’ reaction to major corporations ceasing operations for prolonged periods of time for lack of inventory could be violent. Here’s Barron’s Best & Intermediate Grade Bond Yields going back to 1934. Since December 2018 corporate bond yields have collapsed to levels (extremes) not seen even during the depressing 1930s. How can that be good?
Have you ever had someone move into your neighborhood and ruin everything? Since February 21st Mr Bear moved his residence to lower Manhattan and nothing has been the same since. Proof of that is seen in his report card below. In the past two trading weeks we’ve seen:
-
5 NYSE Days of Extreme Market Breadth _ NYSE 70% A-D Breadth Days
-
7 Dow Jones Days of Extreme Volatility _ 2.00% days
All that violence for ten days attacking market valuations and Mr Bear failed to take the Dow Jones below its BEV -13% level at the end of this week. Should we expect the stock market to hit an air pocket; a stunning one day market decline sometime in March or early April? If these extreme market events continue I’m thinking we should.

The market can trade for years and not see an extreme-market event, and now in the past two weeks we’ve see seven of them? Can this be good? Even if you are a bear, like me, this is not good. In the next few years I expect to make a very nice profit, but for most people that will not be true. It bothers me profiting off of the misfortunes of others. But in our dog-eat-dog world that can’t be helped.
It’s not just the Dow Jones shedding market valuation. In the table below I’ve given the BEV values (percentage declines from last all-time highs) for the major market indexes I follow.
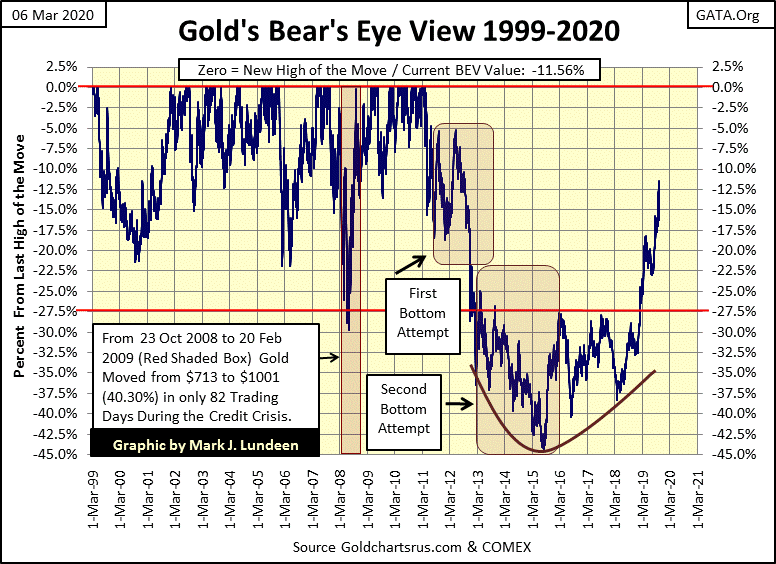
Here’s something of interest for all of my readers; at the close of this week, gold’s BEV was -11.56%. This makes gold closer to its last all-time high than every major-market index below except for the Dow Jones Utility Average. Given the stock market is now deflating in a bear market as the price of gold inflates in a bull market, this is an important market-mile stone we’ve passed this week.
To me, the most interesting thing about this market is the huge increase in daily volatility we’ve seen in these past two weeks. Below is a list of Dow Jones 2% days since early November 2018, when the Dow Jones was seeing its 18% market correction. You’ll notice the Dow Jones saw twelve days of extreme volatility during that correction, plus others in October I didn’t record.

Extreme days #1 to 13 above have all expired from the Dow Jones’ 200 day count, leaving the current 200 count at 12. But extreme day #14 is due to expire come March 18th, with another four extreme days due to expire in early summer.
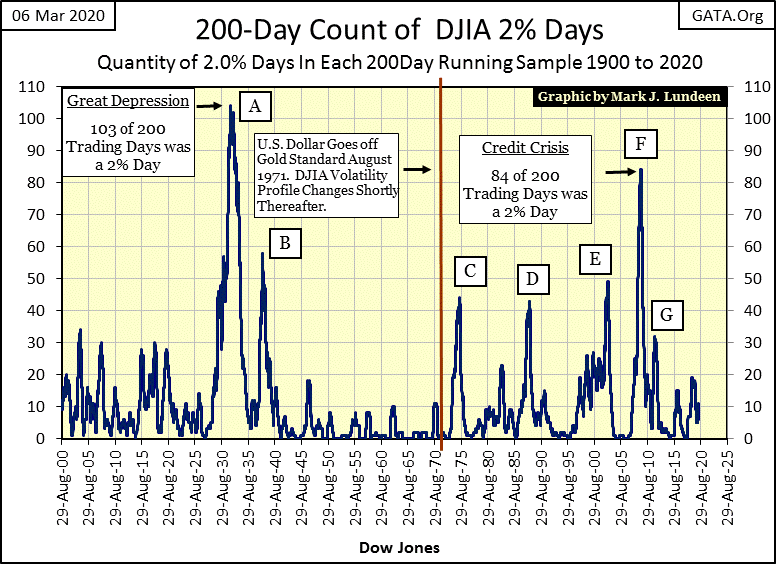
But that leaves seven extreme days in the count that originated in the past two weeks. That’s a lot in only a two week period, something that only happens during major-bear markets, as seen below in the Dow Jones 200 count from 1900 to 2020 – 120 years of market history.
How does one read this chart? Simple: to avoid bear markets get the hell out of the stock market anytime the Dow Jones’ 200 count rises, as I’m assuming is the case now. When should investors return to the market? Hopefully early in the following bull market before everyone else. That too is simple: wait until the Dow Jones’ 200 count peaks at its ultimate bear market bottom, and invest BIG on the collapse in the count.
With the Dow Jones’ 200 count currently at twelve, the Dow Jones is a long way from its ultimate bear market bottom in terms of its point decline, percentage collapse and time. At times such as this patience is a real virtue in the market.
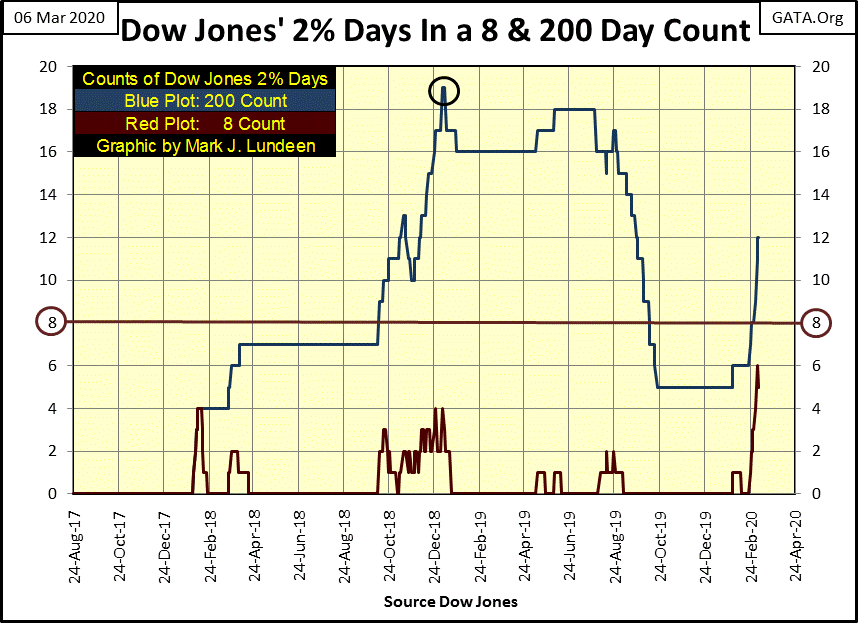
But a 200 count of Dow Jones’ 2% days has a problem; it’s based on a running 200 day sample. 200 days is a long time, so frequently 2% days get stale, as seen in the Dow Jones’ 200 count (Blue Plot / Left Scale) for its Great Depression bear market below. The Great Depression bear market bottomed in July 1932, but the Dow Jones’ 200 count didn’t really begin collapsing until after December 1932, five months later.
So, I also use an eight day count (Red Plot / Right Scale), an 8 day running sample to count the Dow Jones’ days of extreme volatility. Using an 8 day running sample to count the days’ of extreme volatility in the Dow Jones, along with a 200 day running sample is an effective technique to monitor volatility in a bear market.
This week in Mr Bear’s Report Card above, the Dow Jones 8 count reached a peak of 6 on Wednesday and Thursday. That’s something that rarely happens, something that occurs exclusively in bear markets, at least so far anyway.
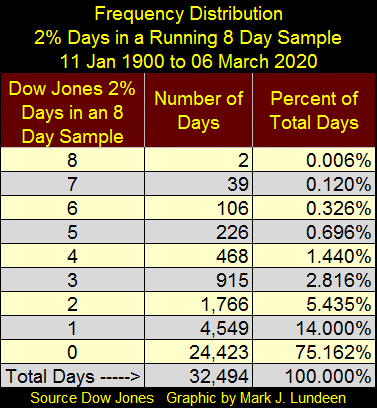
I did a frequency distribution table on the Dow Jones’ 8 counts from January 1900 to the close of this week for the 32,494 NYSE trading sessions during this time period. Since January 1900, the Dow’s 8 count registered a 6 in only 106 of its daily closings, or in only 0.326% of its daily closings for the past 120 years. Most of the other 8 counts of 6 are seen in the chart above during the Great Depression.
Next are the Dow Jones’ 8 & 200 counts since August 2017. In December 2018 (black circle) the Dow Jones saw its largest correction (18%) since the bottom of the 2007-2009 bear market, and the rising market volatility this bull-market correction produced is easily seen in both the counts.
But here is the problem: a 200 day running sample takes a long time to shed stale 2% days. So, the 200 count didn’t actually decline until the August following the December’s 18% correction bottom.
This problem is solved using an 8 day running sample. For an intrepid investor, seeing the 8 count go to zero for a few weeks after the Dow Jones saw its December 18% decline could have justified their reentry into the market.
As it turned out that was the correct thing to do in January 2019, as was exiting the market in October 2018 when the Dow Jones’ 8 and 200 counts began to rise.
Following these counts of the Dow Jones’ days of extreme-market volatility are simple techniques that anyone who takes the time to daily track the Dow Jones closing values in a spreadsheet can use.
And I’m going to use them right now; with the Dow Jones’ 8 & 200 count rising as seen above, I can’t say we’re at the edge of a massive bear-market decline, but further declines are very likely to come. And I’m not going to become bullish again until the Dow Jones ceases these bearish 2% daily moves.
If we are at the edge of a simple correction that began in the last week of February 2020, these counts will soon decline as the Dow Jones once again advances in a bullish fashion. Until that happens, the 120 year history of the Dow Jones strongly suggests we stay out of the market.
But if we are on the edge of THE-BIG-ONE, the 200 count will continue advancing to much higher levels as the 8 count enters a period where it refuses to remain at zero for weeks, months and possibly years. This was exactly what happened in the early 1930s and again during the 2007-2009 credit crisis bear market but to a much lesser degree.
Look at the Dow Jones’ 8 count frequency distribution table above. Since January 1900 its 8 count had registered a zero for 75% of its daily closings, and the remaining 25% of those daily closings (8 counts above zero), saw the Dow Jones under selling pressure more times than not.
At what BEV value did gold close the week at: -11.56%? Oh ya, with the Dow Jones closing the week with a BEV value of -12.48%, an important market milestone was passed this week; gold is now closer to its last all-time high than is the Dow Jones. I know I said this above, but it’s been so long since the last time this was true, I feel as giddy as a school girl thinking about it, I just want to spread my tiny wings and fly!
Enough of that; should a selling panic develop in the stock market in the coming weeks, a likely situation to develop in my opinion, gold at this level could easily trade at new all-time highs before April. This is not a prediction on my part, I’m just noting the obvious; a BEV of 11.56% from an all-time high isn’t much of a move for gold to make should the financial markets descend into a deflationary panic.
Like me, my readers will just have to wait to see what happens in the markets before April, but Geeze Louise, just look at gold’s BEV chart below. We may never see another outrageously bullish chart such as this again in our lifetime.
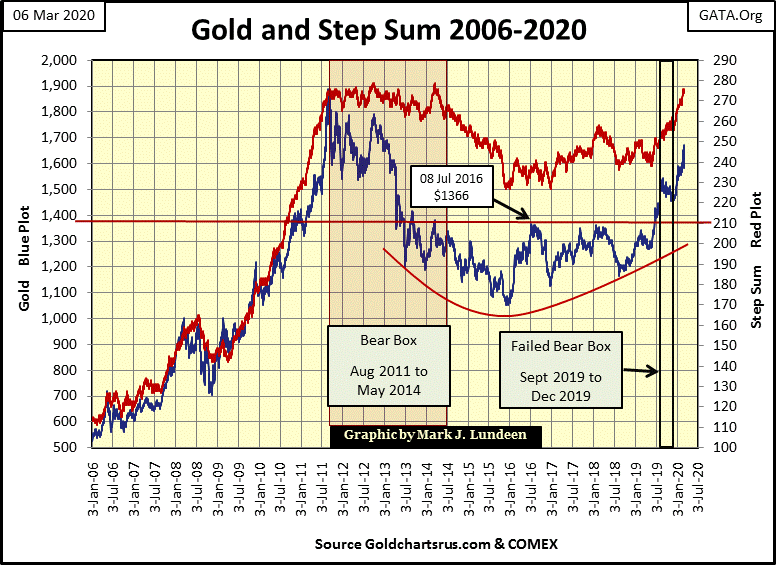
And if you like gold’s BEV chart above, you have to LOVE its step sum chart below! Seeing the price of gold turn on a dime last December, forcing that four month bear box to fail is just the cherry on the top of this delightful dish.
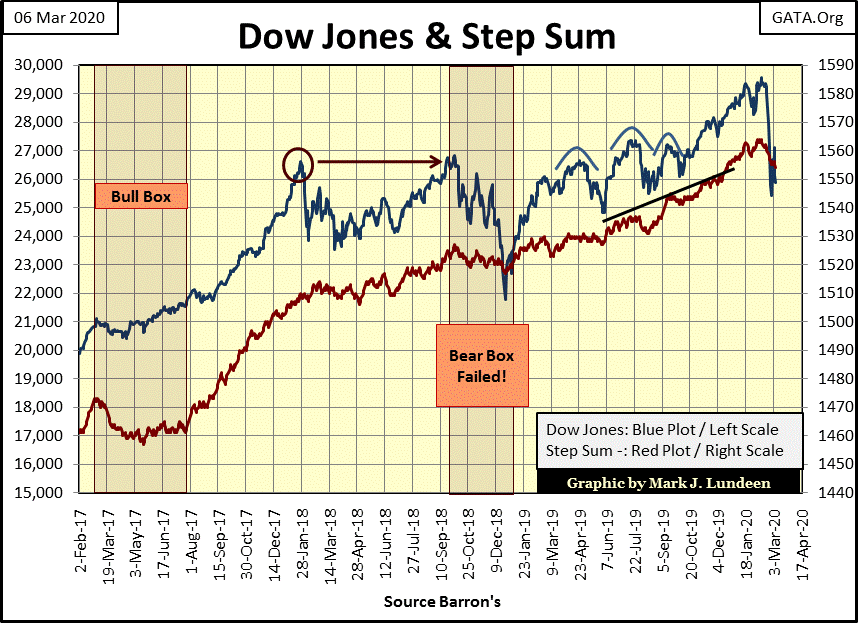
As with the Dow Jones’ BEV chart above, its step sum chart below is little changed from last week. But we have to keep in mind what we are looking at here; since March 2009 the Dow Jones has advanced by 23,000 points in eleven years. That’s a massive expansion in market valuations in one, if not the longest advance in market history. And in the past two weeks the market has suffered from seven Dow Jones 2% days and five NYSE 70% A-D days? Well, I don’t like it.
If someone wants to buy stocks at their current discounted values, or just stay in to wait out our current market decline, I think they’ll regret it, and the Federal Reserve won’t come to their rescue.
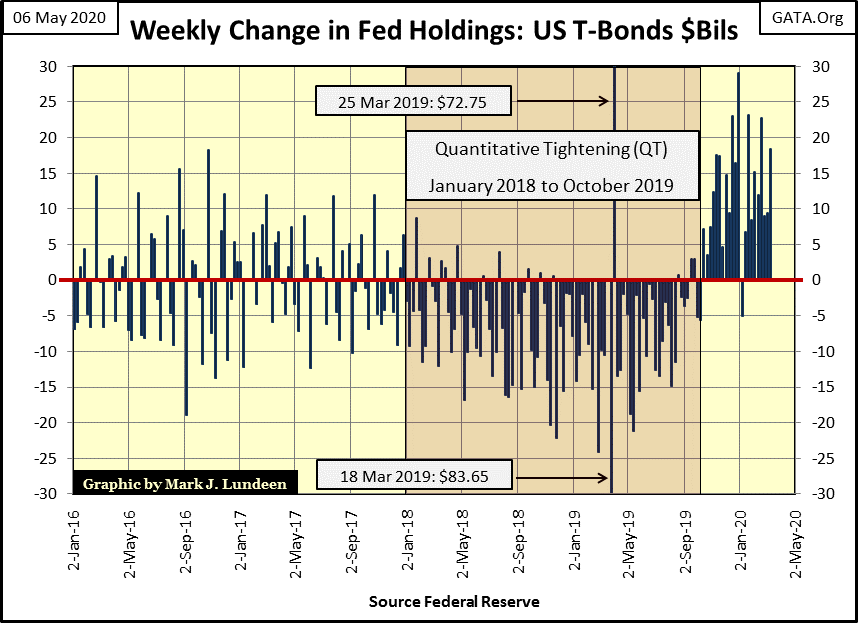
Since October the FOMC has been “injecting liquidity” into the financial system (chart below). That was all well and good; until two weeks ago when the stock market began upchucking the “liquidity” the Federal Reserve has been supplying it.
* THIS IS NOT GOOD! *
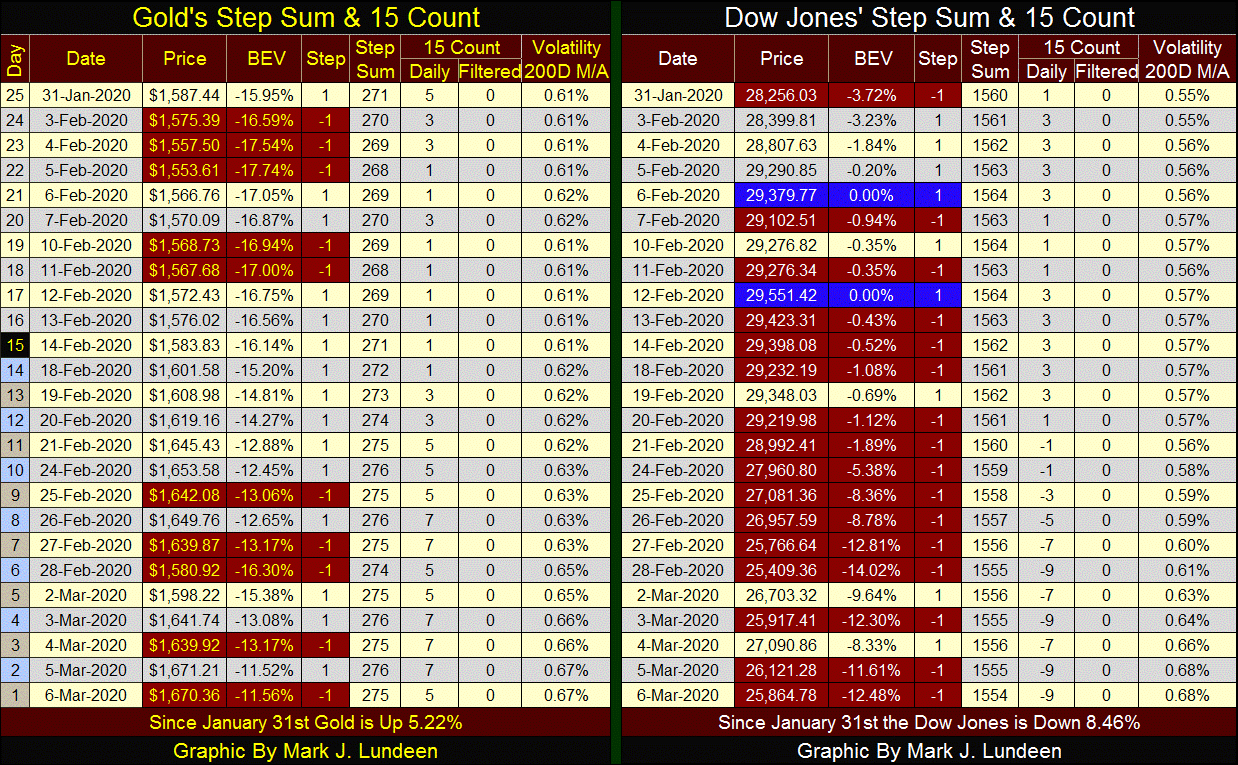
In the step sum tables below, in the past twenty-five trading sessions gold is up 5.22% while the Dow Jones has deflated 8.46%. That sums things up nicely. But we should also note that the step sum (market sentiment) for gold continues to advance, as the step sum for the Dow Jones is now declining with the Dow Jones itself.
The 15 count for gold closed the week at +5, so it’s not overbought. But the Dow Jones’ 15 count closed the week at a -9; well into oversold territory. Normally I’d expect a bounce in the Dow Jones from here. However with the twelve extreme-market events in the past ten NYSE trading sessions:
-
7 Dow Jones 2% days
-
5 NYSE 70% A-D days
…and after all that the Dow Jones failed to break below -13% from its last all-time high? I’m just going to be a spectator in this market until the stock market stops seeing these extreme-market events.
In early March 2020 I really do think it’s best to just take a seat in the peanut gallery and treat the stock market strictly as a spectator sport until we see the last of these extreme market events in the market’s rearview mirror. In a worst case scenario, that could be years from now – so what’s the hurry?
Mark J. Lundeen
********


