Gold, Silver, Copper Analysis: XAU/USD and XAG/USD Surge Amid Geopolitical Tensions
NEW YORK (October 18) Amid Israel-Gaza tensions, XAU/USD and XAG/USD spot values hint at bullish momentum in today’s financial news analysis.
China’s year-over-year retail sales also saw an increase of 5.5%, outdoing the previous 4.6% and anticipated 4.9%. This could have ripple effects on gold, silver, and copper prices.
Gold Prices Forecast

Gold (XAU/USD) has seen a positive trajectory today, with the price settling at a robust $1939.845, marking a commendable increase of +1.09% over the past 24 hours. Analyzing the 4-hour chart, the metal currently stands just above a pivotal point of $1932. Looking at resistance and support levels, the immediate resistance is pegged at $1950, followed by $1967 and $1984.
Conversely, gold finds its immediate support at $1909, with further cushions at $1886 and $1869. The technical indicators reveal noteworthy insights. With the Relative Strength Index (RSI) at 73, the metal is overbought, signalling strong bullish momentum.
Furthermore, the Moving Average Convergence Divergence (MACD) indicates a potential upward momentum as the MACD line is above the signal line. The price above its 50-day Exponential Moving Average (EMA) of $1895 further accentuates the short-term bullish sentiment.
From a chart pattern perspective, a bullish engulfing candle coupled with a breakout above the $1931 resistance suggests the possibility of more upward movement in the near future.
In conclusion, the overall trend for gold appears bullish above $1932.
Silver Prices Forecast

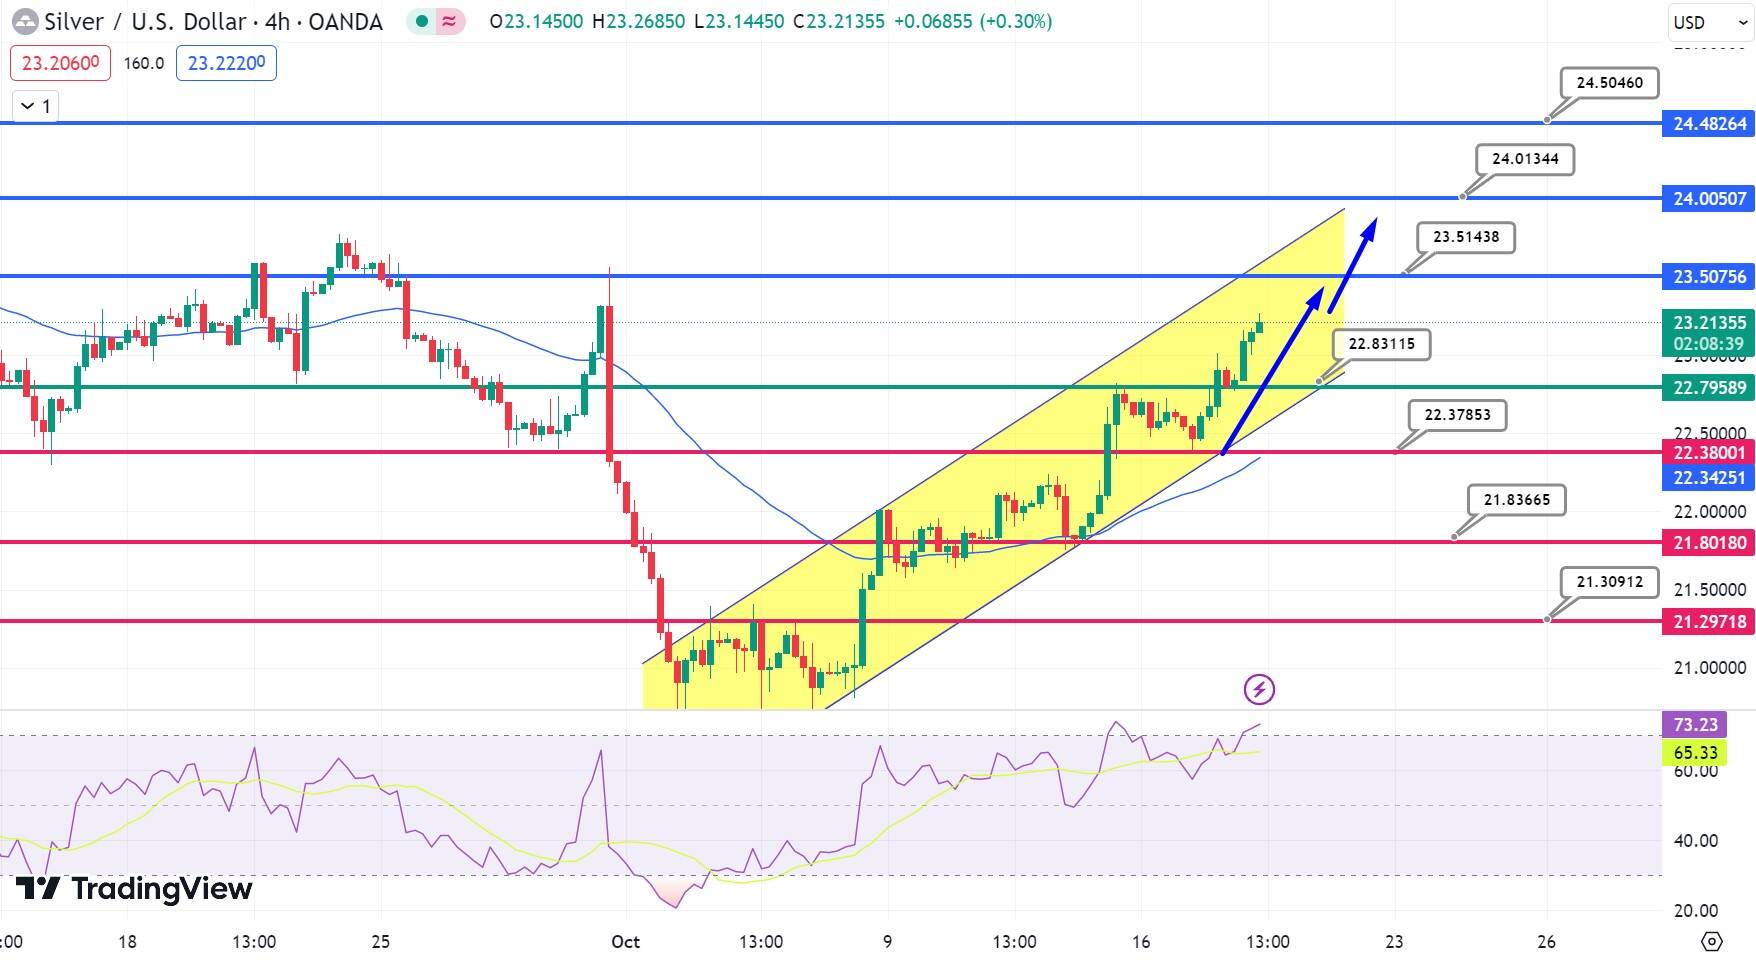
Silver (XAG/USD)‘s performance today displayed an upward momentum, with its value closing at $23.1764, representing a +1.78% increase over the past 24 hours. Analyzing its position on a 4-hour chart, silver is positioned just above the critical pivot point of $22.83.
When deciphering resistance and support metrics, the immediate resistance is noted at $23.51, with subsequent resistances at $24.01 and $24.50. Conversely, support levels are charted at $22.38, with subsequent support barriers at $21.84 and $21.31.
Diving into technical specifics, the Relative Strength Index (RSI) stands at 72, indicating that silver is in overbought conditions, reflecting an undercurrent of bullish sentiment. Its positioning above the 50-day Exponential Moving Average (EMA) of $22.34 reinforces this bullish inclination.
Chart patterns, notably the upward channel and the presence of the ‘Three White Soldiers’ candlestick formation, further affirm the bullish trajectory for silver, targeting the $23.50 mark. In conclusion, silver manifests a bullish trend beyond $22.85. The short-term forecast anticipates silver to challenge upper resistance levels soon.
Copper Prices Forecast

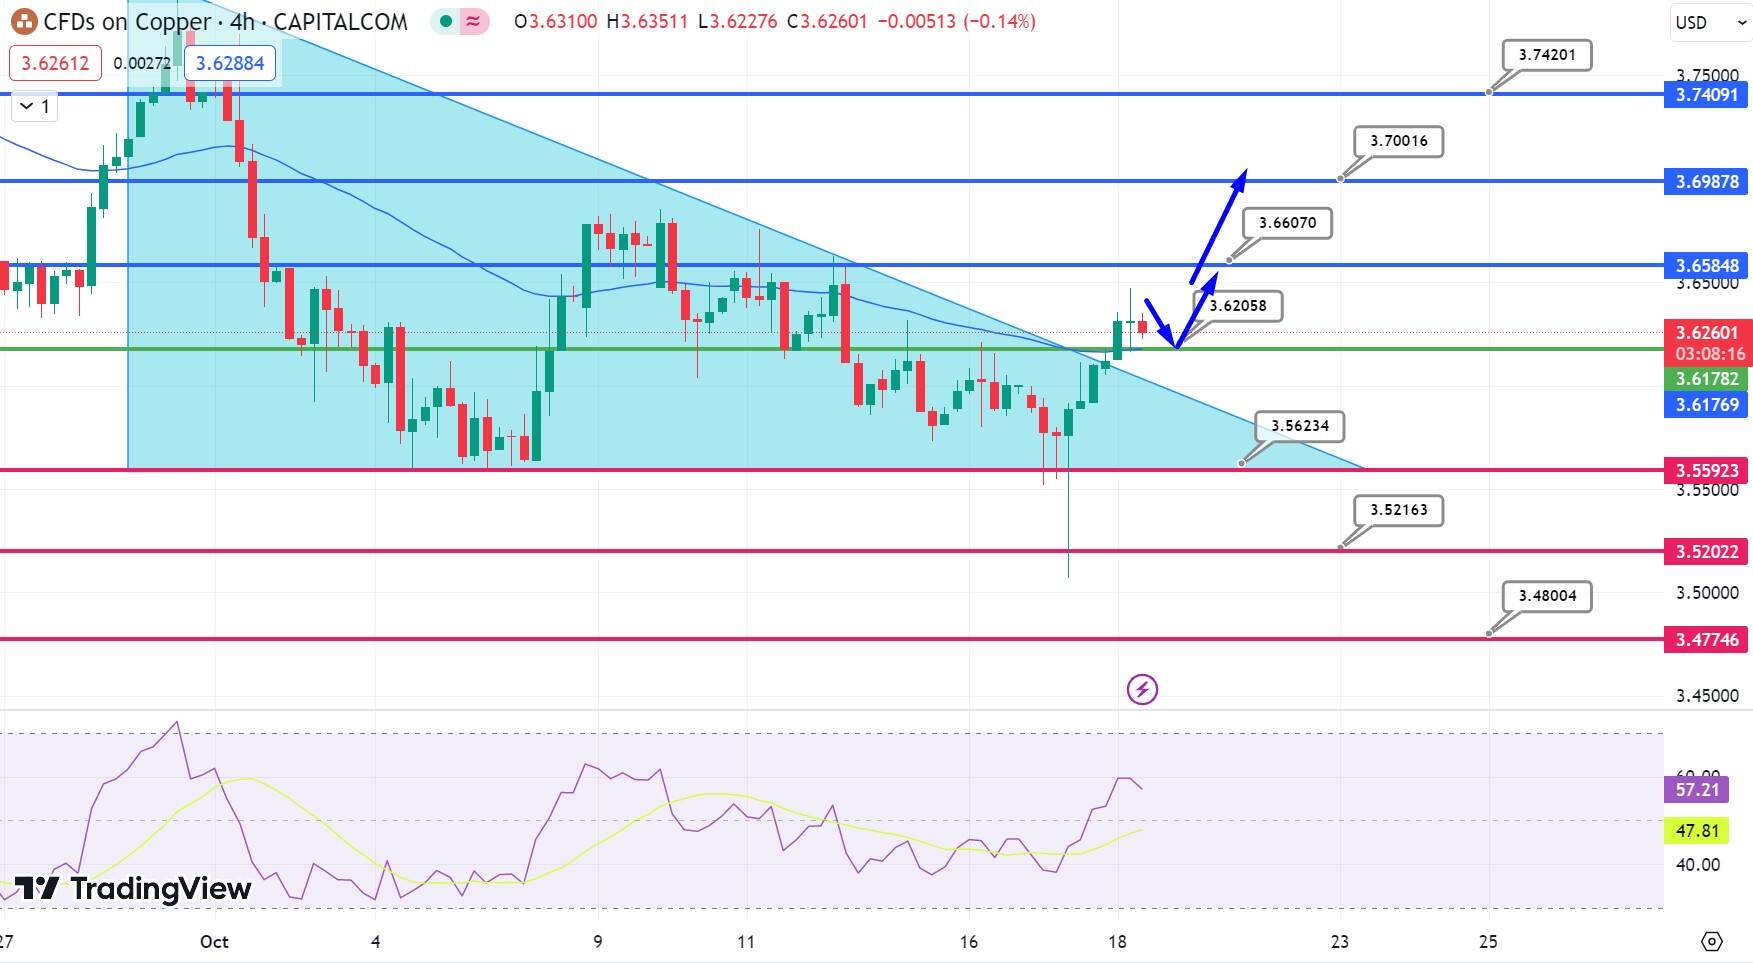
Copper Chart
On October 18th, Copper‘s trajectory presented an optimistic stance, closing at $3.64356, a modest rise of +0.44% within the 24-hour span. A glimpse into the 4-hour chart situates the metal just a notch above its pivot point of $3.62.
Mapping the resistance and support terrains, the metal encounters its first resistance at $3.66, followed closely by $3.70 and $3.74. On the defensive side, Copper finds sanctuary at $3.56, with subsequent fallbacks set at $3.52 and $3.48.
From a technical lens, Copper’s standing just above its 50-day Exponential Moving Average (EMA) of $3.62 hints at a short-term bullish trend. The chart elucidates a prominent descending triangle breakout around the $3.60 mark, which promotes a buying sentiment.
The consecutive candle closures outside this triangle coupled with the 50 EMA bullish crossover further endorses the bullish tilt. Summarily, Copper showcases a bullish demeanor past the $3.62 threshold.
d Israel-Gaza tensions, XAU/USD and XAG/USD spot values hint at bullish momentum in today’s financial news analysis.
Quick Fundamental Outlook
The discrepancies arose over an Israeli airstrike in Gaza: local authorities reported 500 hospital casualties, while Israel attributed it to a Palestinian attack, as per Reuters. These geopolitical tensions and positive economic data from China might influence precious metals.
China’s Q3 GDP surpassed forecasts, registering a 1.3% growth against the predicted 1.0%. The annual growth for the same period was 4.9%, beating the 4.4% estimate.
FXEmpire


