Gold Eyes $2045 as US Dollar Stalls Despite Fading Rate Cut Hopes: Levels to Watch
LONDON (February 20) US Dollar's 2024 uptrend has shown signs of slowing down recently despite the US CPI and PPI data coming in higher-than-expected last week.
This combination of factors is helping gold build new upward momentum, possibly aiming to surpass the $2K mark again soon, as investors looking for safe-haven assets are progressively seeing the yellow metal as a superior choice to the greenback amid high monetary policy uncertainty.
Let's have a look at the fundamental factors behind this potential run - as well as trading levels to keep an eye on.
Gold Builds Momentum as US Dollar Uptrend Loses Steam
gold charts reveal a small surge in the price from last week's low of $1,984. This reversal coincides with a decrease in the dollar's upward momentum and ongoing geopolitical risks in the Middle East.
Despite short-term pullbacks, gold, a recognized safe-haven asset, holds positive medium-term expectations. Starting the week at $2,020, gold found support at the bottom line of the 2024 falling channel.
Initiating the new week positively, the precious metal accelerated above the channel's center line. With current bullish potential in the short-term, gold might reach $2,045, maintaining its upward trajectory as long as it stays above $2,015 this week.
The Stochastic RSI on the daily chart, exhibiting a steep exit from the oversold zone, further supports the potential value increase in gold.
The conclusion of the Lunar New Year holiday in China could boost gold demand, potentially increasing trading volumes. Surpassing $2,045 might break the falling channel pattern in 2024, contingent on exceeding this critical resistance.
A weekly close above $2,045 sets the next target at $2,080, with a potential upward trend reaching the range of $2,100 - $2,130 upon surpassing this zone.
Conversely, in a potential pullback, a weekly close below $2,015 could nullify the recovery momentum, indicating gold may establish a bottom below $2,000 again.
DXY: Bull Run Could Be Starting to Fade
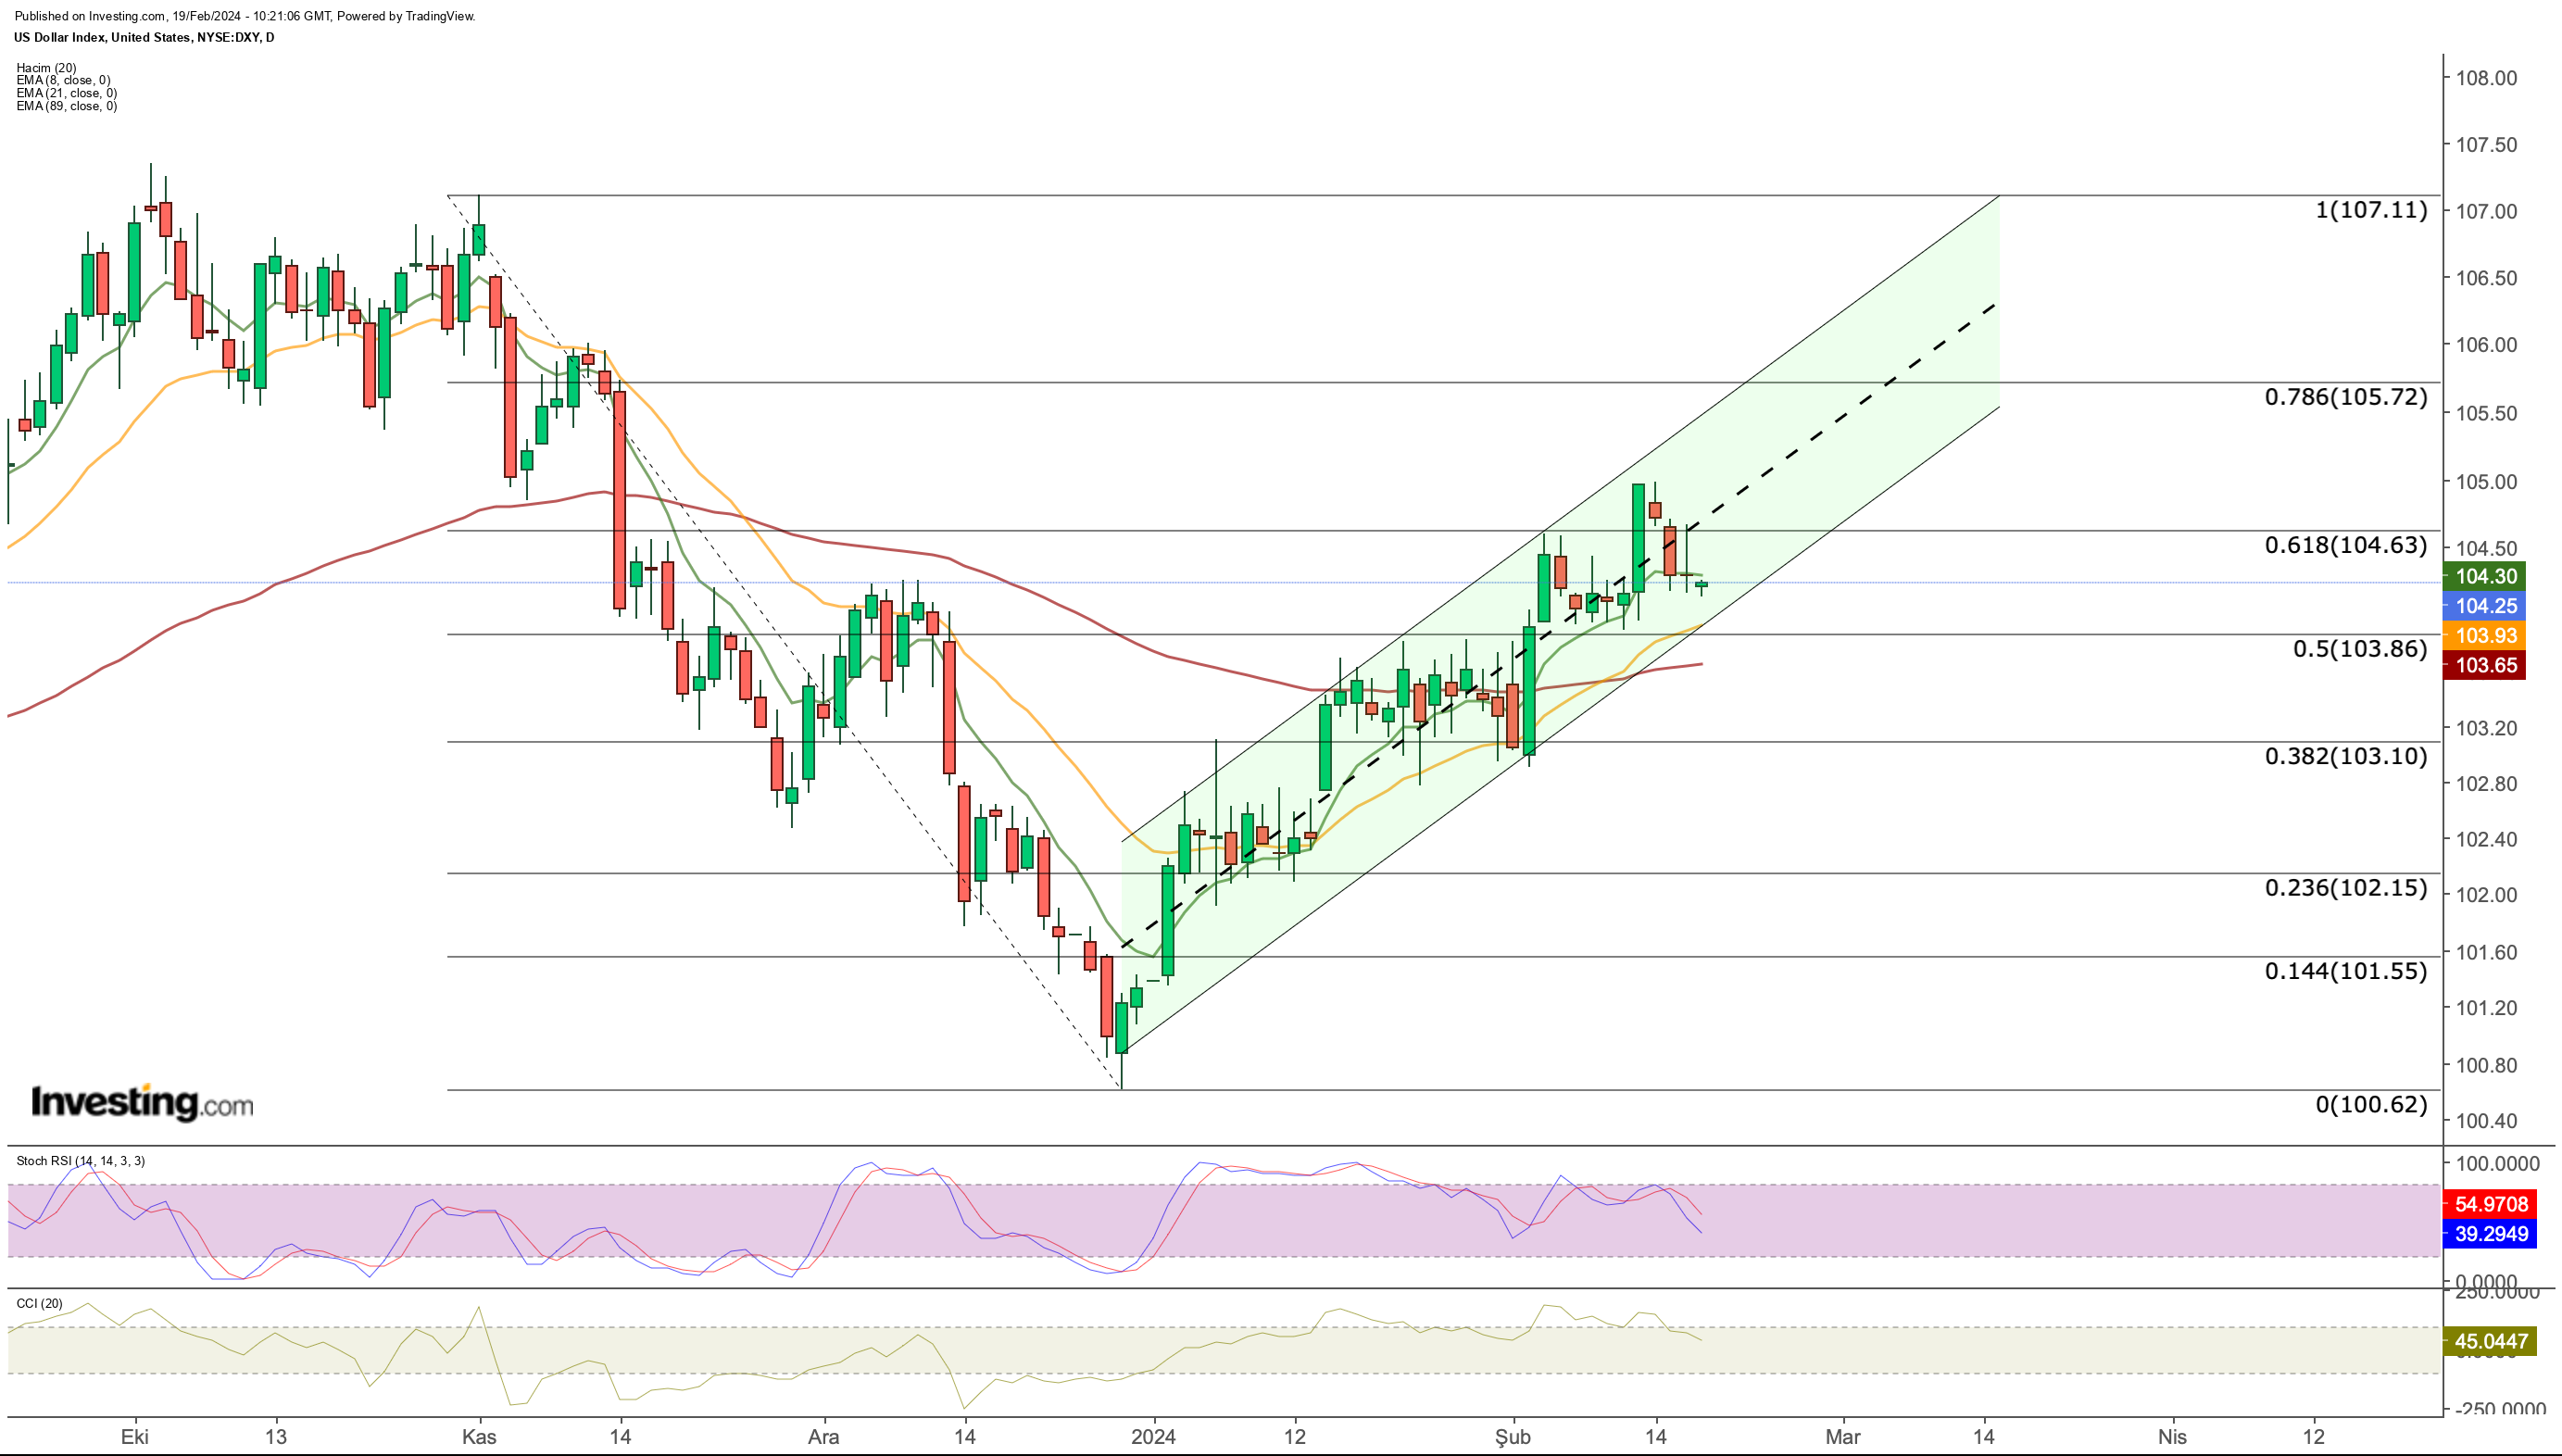
A closer look at the DXY chart reveals a loss of upward momentum towards the week's end, attributed to reduced demand for the dollar following reports of declining retail sales last month.

Dollar Index Price Chart
Currently, market sentiment leans towards skepticism regarding the dollar, evident with the demand declining post retail sales data last Thursday, despite the earlier demand spurred by the Consumer Price Index (CPI).
The new week commenced with DXY at 104.2, accompanied by lower volume as markets observed the US Presidents' Day holiday today.
FOMC minutes, February PMIs, and statements from Fed members are set to be the primary catalysts for a directional move this week.
Investing.com


