Sentiment Speaks: If You Follow The Fed Then You Are Behind The Curve


Through the years, I have attempted to explain to those reading my missives that believing that any entity has control over the market is absolutely absurd. And, no matter how many empirical examples I have provided through the years, the common failure to recognize the truth represented by these facts causes most people to perform mental gymnastics in order for them to retain their prior erroneous beliefs.
One such example is the absolute belief that the Fed controls various markets.
While most believe that the Fed controls the equity markets, I have often used this chart to show that the Fed is actually powerless when market sentiment is moving as a high speed train in the opposite direction.
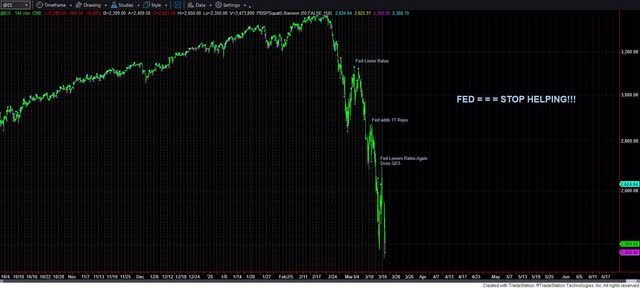
As you can clearly see, the Fed attempted multiple times to stop the Covid Crash, but was clearly unable to do so. This is an absolute and incontrovertible fact which can easily be gleaned by looking at the simple chart above. As for the mental gymnastics, well, the common refrain is that the market “eventually” bottomed due to the Fed. So, let’s consider this specious argument.
Let me begin with a story. When my eldest children were 3 and 5 years old, and we were stopped at a traffic light, they would look at the traffic light, and say “now,” as they try to time the light changing back to green. And, if it did not change at their first attempt, they again would yell out “now.” And, this goes on for maybe another 10 to 15 times, depending on how long the light takes to change. Yet, when the light finally changes at one of their “now’s,” they proudly assume that they caught that timing ever so perfectly and caused the light to change colors.
Does this not compare to those who maintain the belief that the Fed “eventually” caused the market to bottom? Eventually, the market turned up just like the traffic light eventually turned color. While we know that the traffic light has an internal mechanism that changes the color of the light at specific intervals, most people do not understand that the market works in somewhat of a similar manner.
You see, before the market even turned down in February of 2020, I was posting public analysis in the 4th quarter of 2019 which was calling for a 30% decline, likely beginning in the 1st quarter of 2020. And, this is before anyone even heard the word Covid. Moreover, I had an ideal target of 2200SPX for that decline, and the market bottomed at 2187, within 13 points of my ideal target set many months before.
Of course, many will dismiss my analysis as me getting lucky with not just the market call for a 30% decline, but in also getting lucky with the call that the market should bottom in the 2200SPX region. Yet, anyone who has tracked me over the course of my 13+ year career in providing public analysis knows that I am very lucky person many times over. (smile).
It is all simply from understanding that exogenous factors are not as important as many tend to believe. And, as more and more studies are conducted on the stock market, the more and more we understand this truth to be evident. For example, in a paper entitled “Large Financial Crashes,” published in 1997 in Physica A., a publication of the European Physical Society, the authors, within their conclusions, present a nice summation for the overall herding phenomena within financial markets:
“Stock markets are fascinating structures with analogies to what is arguably the most complex dynamical system found in natural sciences, i.e., the human mind. Instead of the usual interpretation of the Efficient Market Hypothesis in which traders extract and incorporate consciously (by their action) all information contained in market prices, we propose that the market as a whole can exhibit an “emergent” behavior not shared by any of its constituents. In other words, we have in mind the process of the emergence of intelligent behavior at a macroscopic scale that individuals at the microscopic scales have no idea of. This process has been discussed in biology for instance in the animal populations such as ant colonies or in connection with the emergence of consciousness.”
Now, to add a bit more color to the fact that the Fed was clearly unable to stop that decline in early 2020, let’s consider the wise words of a former Fed Chairman, Alan Greenspan:
“It's only when the markets are perceived to have exhausted themselves on the downside that they turn.”
So, let’s now consider the two opposing rationalizations presented within this scenario.
The first camp believes that the Fed “eventually” caused the market to bottom after many failed attempts all the way down, in a similar manner as to how my children “caused” the light to turn green based upon their multiple declarations of the word “now.”
The second camp believes, as Mr. Greenspan does, that the market bottomed when it exhausted itself to the downside. And, that downside was calculated relatively accurately based upon a methodology utilizing Fibonacci mathematics.
Which do you think is a more reasonable rationalization?
Before you answer, allow me to present yet another market instance which has recently caused quite a bit of head scratching.
First, I want to begin with another time we caught a major bottom. Back on October 21, I posted an analysis of TLT to the members of The Market Pinball Wizard entitled “Bottoming Signs.” And, it outlined my expectation for TLT to bottom in the 83 region and begin an initial rally with an ideal target of 105. You can see the chart published with that analysis below.
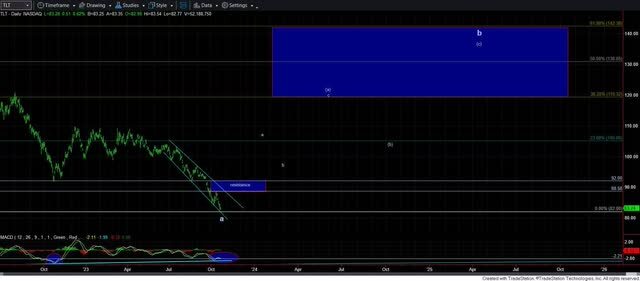
Now, I want to remind you that, at the time, everyone was quite convinced that the Fed was going to continue raising rates, causing bonds to drop much lower. In fact, I was actually hearing calls for TLT to drop down into the 60’s at the time.
As the market began to rally well before any discussions of the Fed lowering rates, it developed a structure within that rally that caused me to modify my target for that a-wave rally to the 101.92-105 region.
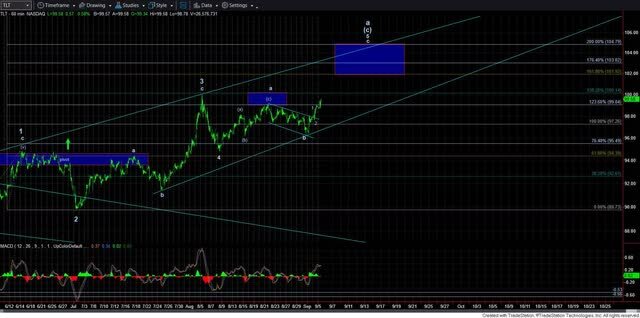
And, as we know now, the TLT topped at 101.84, within 8 cents of the bottom of our target region.
Yet, what makes this much more amusing is that it topped when the Fed began to announce its intention to lower interest rates. Yes, my friends, the TLT topped on September 17th, and the Fed announced its intentions on September 18th. Now, most people would have expected the TLT to continue rallying on that news. As one of my members noted:
“I work in the Mortgage Industry and the volume of new locks shot up after the Fed "lowered", even though rates have only gone up.”
But, as he correctly also noted, rates began to rise the day before the Fed announced its intention to lower interest rates. And, this has been one of the biggest head scratchers for bond investors in quite some time. Again, it is simply because they are following the wrong factors when attempting to discern the direction of interest rates. Here we have further proof that the Fed is truly not in control of the market.
Ultimately, the Fed simply follows the market. Remember, the market bottomed in October of 2023, as we have seen how the TLT bottomed at that time and began a 20%+ rally during a time when everyone was still expecting the Fed to continue raising rates. Then, when the Fed finally followed the market in lowering rates, the market made the Fed look even more foolish by starting its decline in bonds the day before the Fed announcement.
While I can and have provided further empirical evidence in prior articles I have published, I am quite confident that many will still retain their erroneous beliefs that the Fed controls the market. In fact, I am quite certain that we will still see many examples of mental gymnastics being performed in the comment section below. Yet, I hope at least some of you are going to open your eyes to the truth regarding commonly accepted false drivers of market mechanics.
Avi Gilburt is founder of ElliottWaveTrader.net.
********
 Avi Gilburt is a widely followed Elliott Wave technical analyst and author of ElliottWaveTrader.net, a live Trading Room featuring his intraday market analysis (including emini S&P500, metals, oil, USD & VXX), interactive member-analyst forum, and detailed library of Elliott Wave education. You can contact Avi at: [email protected].


