Gold is on the Cusp of 2 Huge Breakouts
There have been quite a few breakouts this year in precious metals.
None have been bigger or more significant than Gold breaking out of its 13-year cup and handle pattern and clearing $2100/oz easily.
Although it is overbought and could pause or correct, it remains bullish and on track for its $3,000/oz target.
Other breakouts include Silver taking out four-year long resistance around $29/oz and GDX doing the same, although it has reversed course, largely due to Newmont Mining’s weakness. But I digress.
There are two very important breakouts setting up that have hugely bullish long-term implications for precious metals.
First, is Gold against the 60/40 portfolio (total return), which is plotted in the chart below along with nominal Gold and Silver.
We are unable to see but Gold to 60/40 ratio closed October above the red resistance line and at a three-year high. This breakout is not confirmed and confirmation could require a few months.
However, the larger point is the historical significance. After the ratios broke resistance in 1972 and 2002, it confirmed a new secular bull market in precious metals.
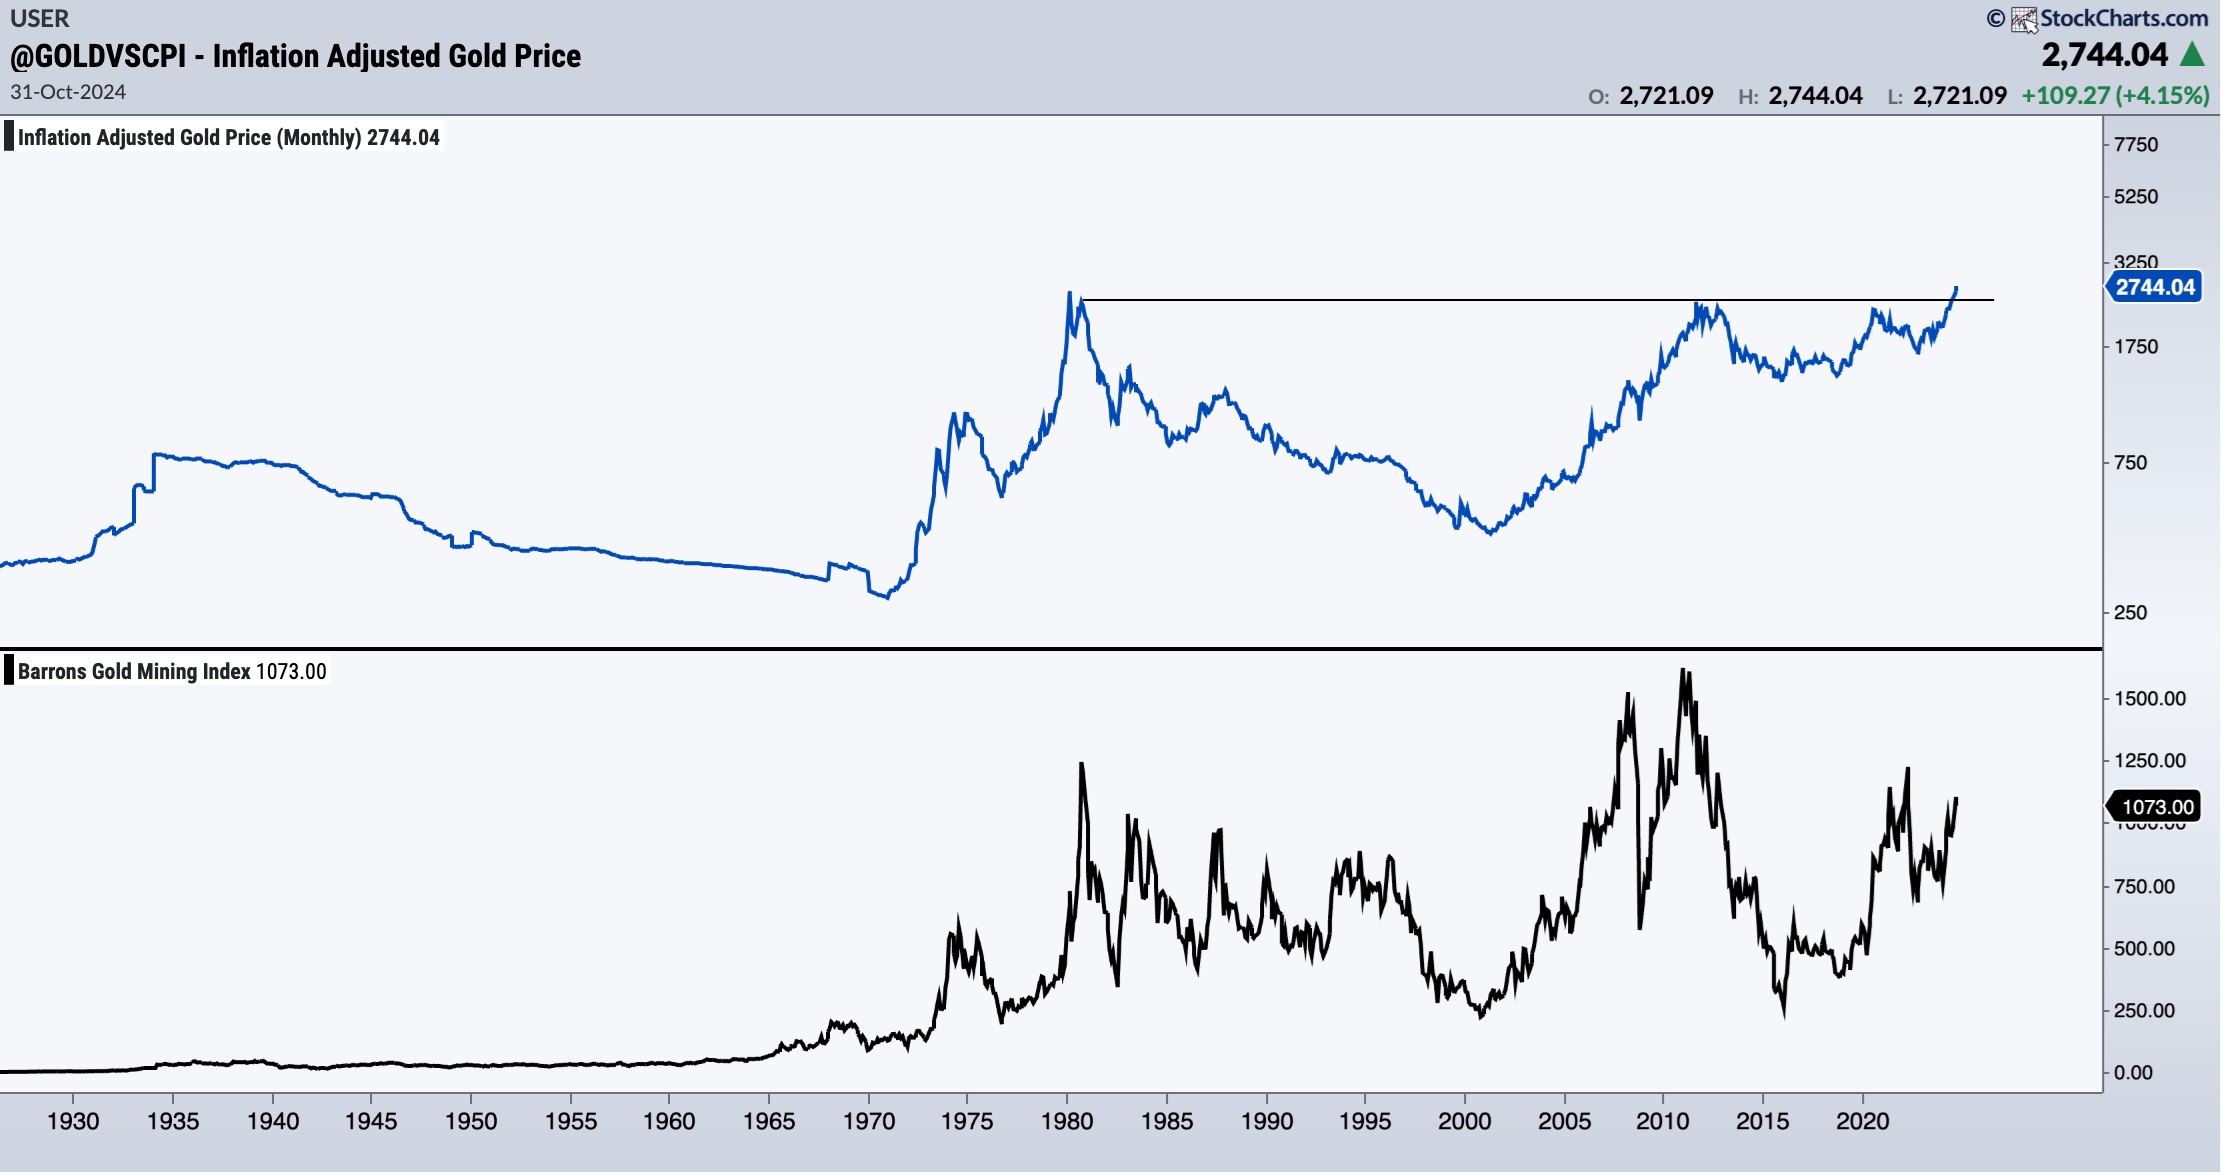
Second, is the inflation-adjusted Gold price, closing in on a breakout from a 45-year base.
According to MacroTrends data, the inflation-adjusted Gold price closed October at its second highest level in history. It was only $3/oz away from an all-time high.
Using Gold against the current CPI shows the third highest monthly close ever and within 2% of an all-time high.
The inflation-adjusted Gold price is important because it is an excellent indicator for the long-term performance of gold stocks. Gold against the CPI correlates closely with gold mining margins.
Precious Metals are currently declining as they have enjoyed a strong run for many months.
Silver tested monthly resistance at $35 and sold off while Gold reached $2800 but backed off. Days ago, the percentage of GDX and GDXJ stocks above the 20-day, 50-day and 200-day moving average was +95%.
The sector is cooling off and that is a good thing, as vertical moves lead to interim peaks.
Use this weakness to identify and focus on juniors with quality assets and value.
You will want to position before Gold explodes higher against the 60/40 portfolio and breaks out of its 45-year base against inflation.
********


