Gold & Silver Are Rebounding
Gold bugs were rattled by the drop of more than $200 over the past two weeks, but this week's big rally has clawed much of that back in one fell swoop.
The question remains whether the bull market is back in force over the short term or whether this is merely a technical bounce.
The big decline in gold and silver over the past couple of weeks was fostered by the belief that the incoming Trump administration was going to halt the upward trajectory of federal spending and choose Bitcoin over the metal as the next key component of sovereign reserves.
Or...traders sensed that the market might be gullible enough to believe all of that and started driving the paper gold price lower in search of one sell stop after another.
It will come as no surprise to you that I have subscribed to the latter view in terms of what was driving the big sell-off — and that’s why I predicted a rebound was imminent.
That rebound may be in progress right now, with today’s big surge in gold serving as the proximal evidence.
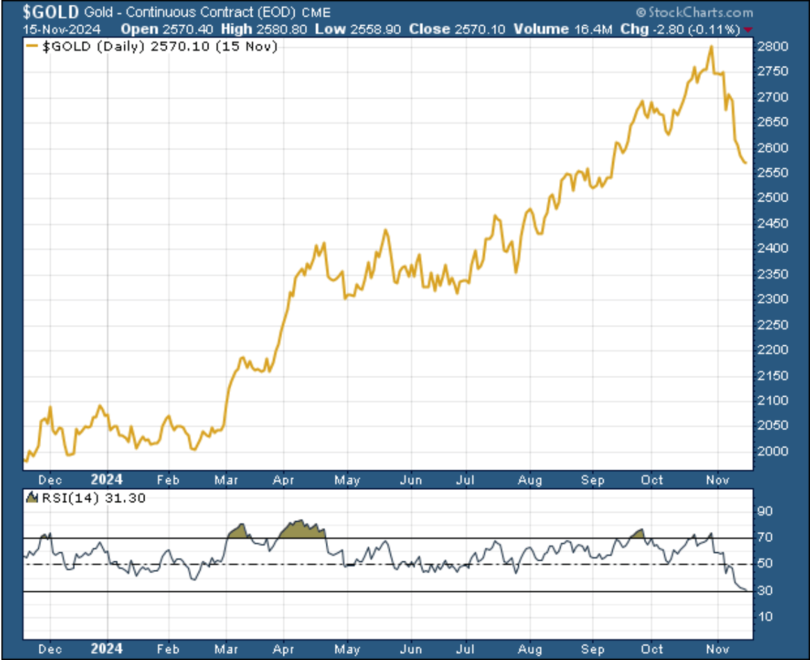
As you can see, the correction was severe, taking gold about 10% lower. But today’s rebound — with gold up about $46 as I write — has regained nearly 2% of that loss. And the price still stands about 32% higher than a year ago.
Again, I expected the metals to rebound soon, not only because of the long-term factors of unmanageable and growing debt that no presidential administration could derail but also for the simple reason that gold has quickly rebounded from every setback in this new bull market.
However, the Bollinger band indicator that had so faithfully predicted each ebb and flow in the gold-price trend for months failed us in this case.
Bollinger bands are a measure of volatility, and over the course of this year’s bull market, all the volatility has been to the upside. Thus, the bandwidth had expanded on every rally and contracted during the mild corrections as the gold price traded sideways.
Now, however, the volatility increased as gold was driven down steeply over the past two weeks, and thus, the bandwidth expanded (as seen in the bottom panel in the following chart) to a peak that had previously indicated the top of a rally. Instead, this time, the peak in the bandwidth came at a much lower price.
To determine where we might be in that price decline and if, perhaps, today’s rally shows we’ve bottomed, we need to look at a momentum indicator, as in the following one-year chart showing gold’s relative strength index (RSI).
As you can see, the RSI is in oversold territory. Note also that the indicator seems to have plateaued in this chart, which is based on data as of last Friday’s close. With today’s move, it will have begun to climb once again.
My feeling has been that while our Bollinger band indicator had at least temporarily abandoned us, it had pointed to a fairly regular cycle of ebbs and flows. If the timing of those cycles is to remain relatively consistent, then, as I predicted last week, we are due for an imminent rebound.
And yes, this looks like it could be upon us with today’s big move higher for gold, a move that is being confirmed by silver (up 3.3%) and mining stocks (with the GDXJ up over 5.8%).
As I’ve said, it all adds up to a generational opportunity in metals and miners.
To get Brien Lundin’s ongoing commentary on the markets at no charge, click here to subscribe to his free Golden Opportunities newsletter.
********


