Gold Higher Every Week Year-to-Date


Let’s commence with another infamous Gold Update quiz! Ready?
Since at least this very day a month ago (22 January), what technically until yesterday (21 February) have both Gold and the S&P 500 had in common?
“They’ve been overbought day-after-day, right mmb?”
Spot-on there, Squire. Per near-term widely-used “textbook technicals”, (in our case the potent cocktail of John Bollinger’s Bands, plus Relative Strength and a generous dash of Stochastics), we’ve Gold now “overbought” through the past 29 trading sessions (since 08 January), as had been the case for the S&P 500 through 21 trading sessions (since 22 January) until finally yesterday it began to all go wrong.
But of greater import than technical excess, fundamentally both Gold and the S&P instead remain 180° out of phase. As we regularly remind, whilst the major markets are never wrong, they can be terrifically misvalued. And ’tis quite stark for this pair:
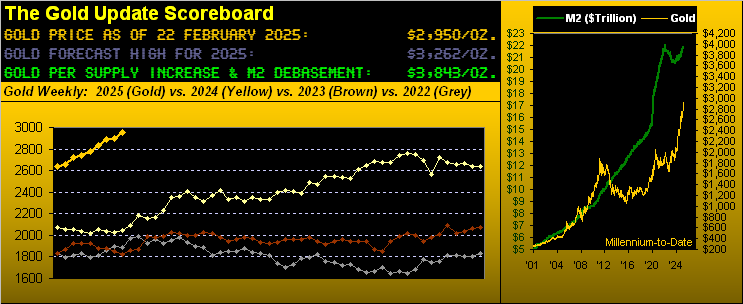
- Gold, in settling the week yesterday (Friday) at 2950, is still well shy of the opening Scoreboard’s Dollar debasement valuation level of 3843; in other words, Gold is trading at a -23% discount to its true value.
- The S&P 500, in settling its week at 6013, remains maniacally expensive, the honestly-calculated price/earnings ratio now 45.7x versus the 25.4x reading a dozen years ago; in other words, the S&P 500 is trading at a +80% premium to such normalized value.
Or if you prefer, the S&P is today at a +154% premium vis-à-vis Jerome B. Cohen’s “in bull markets the average [p/e] level would be about 15 to 18 times earnings”. But we digress…
The point specific to Gold is: to be sure, ’tis still today a magnificent value, even in having achieved yet another marginal All-Time High this past Thursday at 2973. In fact, through these first eight trading weeks of 2025, all have been up for Gold, price itself year-to-date now +12%. Moreover — in the pure vacuum of linear regression — Gold is on pace to finish this year +93% at 5093(!) ‘Course, such level would be ridiculously overvalued above Dollar debasement, and again (as we did pen back in 2011) Gold shall “have gotten ahead of itself”. No, this year ’tis not going to happen.
But in context with our missive’s title, Gold has reached rarified air in terms of consecutive up weeks. Its last down week was that ending last year. And now for just the fifth mutually-exclusive (which for you WestPalmBeachers down there means non-overlapping) instance — for the 1,260 weeks thus far this century — Gold has recorded eight or more consecutive up weeks. Here’s the summary, the current up streak emboldened therein:

Indeed per our prior piece, we’d a bit of a bias toward last week being down. Not so much given Gold’s “textbook overbought” state, but rather by our proprietary, reliable measure of price versus its smooth valuation line, which as you regular readers knows gauges Gold’s movement relative to those of the primary BEGOS Markets (Bond / Euro / Gold / Oil / S&P 500). Here’s the updated graphic from a year ago-to-date, the red encirclements indicative of price essentially being +200 points “high” above the smooth line. Note when this last occurred in April a year ago, price swiftly sank from 2400 to 2300, then to remain stalled in that range until July:
“But the news says everybody’s buying, mmb…”
We love Squire’s tee-up comments, and the FinMedia certainly is taking a rare above-average notice of Gold. ‘Course — courtesy of the “It Takes Two to Tango Dept.” — if “everybody’s buying” then too “everybody’s selling”; ’tis just that more offers are being hit than bids, price thus rising. And as stated, such has been the case through this year’s first eight weeks as we go to Gold’s weekly bars from a year ago-to-date, the rightmost eight closing nubs ascending in green:
Too, never has the phrase “Gold 3000!” been so bandied about by “everybody”. You’ll recall from last week’s wrap our referring to the late Art Cashin (best last name ever for a stock market maven) having quipped that should a stock reach up to the price of 90, then 100 shall trade. And thus Gold having already had 2900 trade would correspondingly see 3000, (which obviously it ultimately shall). For as you know, we’ve Golden Goal Two of “milestone” 3000, and then by year-end, Golden Goal Three of 3262 as our forecast high.
But having been in this business across many-a-decade, one learns that when something “Well obviously!” is imminent to happen … it oft doesn’t. As we’ve clearly set forth, the price of Gold near-term is significantly stretched to the upside such that a series of pullback weeks may well now be in order. Too, as mentioned back at New Year in forecasting 3262 for this year’s high, we specifically stated that the road to that level can reasonably pass through the lower 2500s. And what an additional buying opportunity that would be. As is regularly said in this business, we’ll see…
In seeing to the StateSide economy, the Conference Board issued January’s “Leading Indicators” as having had an on-balance decline of -0.3%, whereas as next depicted in the Economic Barometer, that month’s metrics have instead sported a bit of an up bend. The difference lies in the Conference Board’s assemblage of 10 key monthly indicators versus our aggregation of some 50 metrics. To the Board’s credit, they regularly make prior month revisions such that come February’s report (20 March) we may see January’s result bumped back up a pip or two:
Either way, February metrics from last week showed quite notable month-over-month declines in the National Association of Home Builders Index, the Philadelphia Fed Index, and in the revision to the University of Michigan’s “Go Blue!” Sentiment Survey. And the ensuing week brings the “Fed-favoured” inflation gauge for January of Personal Consumption Expenditures.
But stranger still: the stock market actually went down on the poor news! This hasn’t materially happened (without looking it all up) since the March 2020 onset of COVID. Indeed the new paradigm since then has strictly been “Earnings and economic data are irrelevant because bad news means the Fed has to cut rates!” Or has that strategy of buying stocks on negative news just stopped working?
With the aforementioned S&P 500 p/e ratio now 45.7x, are earnings soon to matter again? With the annualized dividend yield on the S&P now 1.253%, is investing $100,000 in the mighty Index worth the $1,253 return in addition to it being hoovered away and then some should stocks suffer? After all, for the 45 years from 1980 through 2024, the S&P has actually posted years that were down, (’tis said younger traders don’t understand that), in fact on average once every four years … but there’s been only one down year in the past six! Oh no, say it ain’t so!
And yet, $100,000 invested in the U.S. One-Year Treasury Bill now shall return $4,168: that’s more than triple the S&P’s yield and you get your money back! What a concept, eh? Is this at long last the beginning of the end of the Investing Age of Stoopid? Either way, as to the media’s perfect scapegoat upon whom to lay blame … think about it. Once again, on verra…
Too scary, let alone risky, is the stock market. So let’s get back to Gold … Good ol’ Gold!
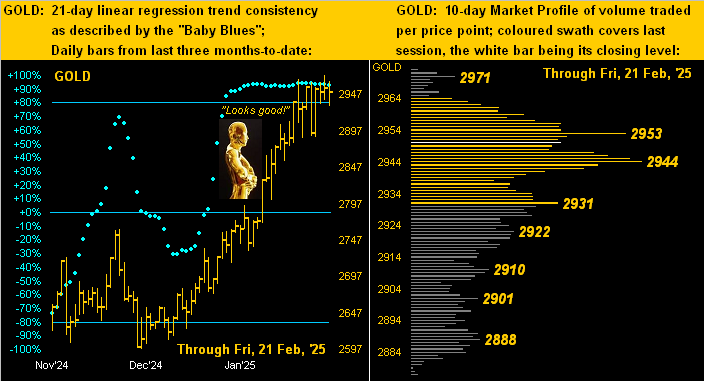
And turning to our two-panel Gold graphic of the daily bars from three months ago-to-date on the left and 10-day Market Profile on the right, never in our immediate memory have we ever seen such a pasting on the ceiling for the baby blue dots of trend consistency. Year-to-date, price has been as close to “straight up” as is conceivable. ‘Course, Gold being a major liquid market, such trend shan’t last; but ’tis been the most amazing ride of late. As for the Profile, note that volume-dominant support falls away below 2931:
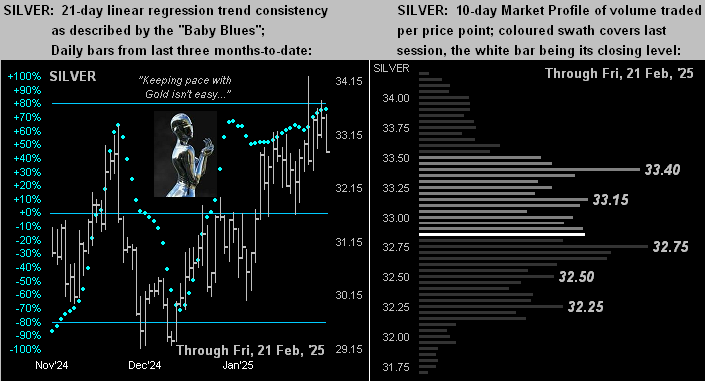
Then there’s “poor ol’ Sister Silver”, albeit trading in the 33s, hardly is she “poor”. But in her like graphic, she’s not been (at left) as robustly up as has been Gold, whilst per her Profile (at right) she’s jammed into the center of a trading range essentially spanning from 32.25 up to 33.40. Yet priced to the century-to-date 68.8x average of the Gold/Silver ratio (the actual ratio currently 89.9x), Silver rather than at 32.83 today would instead be +31% higher at 42.90 … just in case you’re scoring at home:
Speaking of scoring, to wrap, the U.S. Treasury (as you’ve no doubt read) presently “scores” the United States Bullion Depository supply of Gold at $42/oz. Therein said facility — just on the outskirts of Fort Knox, Kentucky — is “officially” (in round numbers) some 147,300,000 ounces of Gold according to “AI” (“Assembled Inaccuracy”), for an accounting value of $6,174,000,000. That is how much the U.S. Federal Government spends about every 10 hours. (Do the math if you must, starting with the annual spend of $6,740,000,000,000). Makes ya feel kinda small, what? However: marked-to-market at $2950/oz. puts the value — were it all liquidated at that price — to a supply total of $433,650,000,000 which essentially would run the federal government for one month. That’s it.
Au contraire Auric. Even if near-term the yellow metal gets sold, you can buy a lot of mint juleps with an ounce of Gold!
Cheers!
…m…
www.TheGoldUpdate.com
www.deMeadville.com
and now on “X”: @deMeadvillePro
********

Mark Mead Baillie has had an extensive business career beginning in banking and financial services for two years with Banque Nationale de Paris to corporate research for three years at Barclays Bank and then for six years as an analyst and corporate lender with Société Générale.
For the last 22 years he has expanded his financial expertise by creating his own financial services company, de Meadville International, which comprehensively follows his BEGOS complex of markets (Bond/Euro/Gold/Oil/S&P) and the trading of the futures therein. He is recognized within the financial community of demonstrating creative technical skills that surpass industry standards toward making highly informed market assessments and his work is featured in Merrill Lynch Wealth Management client presentations. He has adapted such skills into becoming the popular author each week of the prolific “The Gold Update” and is known in the financial website community as “mmb” and “deMeadville”.
Mr. Baillie holds a BS in Business from the University of Southern California and an MBA in Finance from Golden Gate University.
More from Gold-Eagle


