2014…Déjà vu 1987


The Stock Market Crash of October 1987 is indelible in the minds of most veteran investors as a “Financial Tsunami” that came out of nowhere --- which rocked Wall Street to its foundations.
How did this happen?
From January 1987 the S&P500 roared upward through August by nearly +40% from 241 to 337 (an unusually large advance in only an eight month period). Subsequently, a small correction occurred where the S&P500 slid 9% during the next two weeks. However, the stock index bounced back, but failed to surpass the August high.
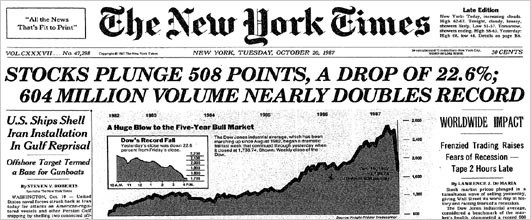
Black Monday October 19, 1987
The crash began in Hong Kong and spread west through international time zones to Europe.
The stocks’ crash began in Asia in early October…and spread to Europe and then to the US. Then stocks began weakening in the US in early October, but the decline gathered momentum in the following weeks...until October 19, 1987 when stocks went into free-fall. On Black Monday October 19, 1987 the Dow Index plummeted 508 points or -23% in one single day. This was the greatest one day loss in the entire 220 year history of Wall Street.
Were there any telltale signs of the 1987 Stocks’ Crash?
Gold Price – From January to late October 1987, gold rose 20% from $400 to $480/oz. However, by yearend 1987 gold topped $500 (up 25% in 1987).
US Dollar Index – The greenback tobogganed downhill by 25% from 105 to 84.
T-Bonds - US Treasuries were the catalyst that forecast and sparked the Stock Market Crash of October 1987. As interest rate soared in 1987, T-Bonds began steeply falling from March through October, when Uncle Sam’s Treasuries fell 26% (truly an unprecedented plunge in only 10 months. In effect T-Bonds sounded the alert of an imminent crash in stocks was brewing on the horizon.
To appreciate the magnitude of the one day -23% stocks crash on Black Monday October 19, 1987, we need to compare it with the greatest one day losses in Wall Street history. See:
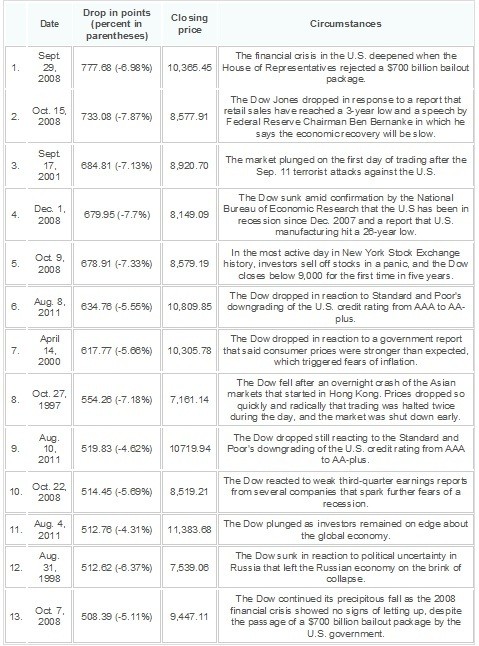
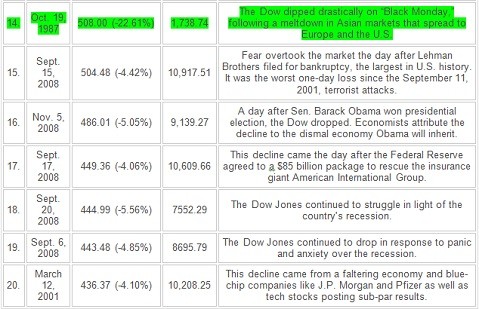
The one-day Black Monday October 19, 1987 crash of nearly 23% was almost four times greater than the average of all the other 19 greatest one-day losses. This is astounding!
What stemmed the tide of the 1987 Stocks’ Crash?
What did Fed Chairman Alan Greenspan do when the stock market crashed on October 19th, 1987? Having learned lessons from the actions taken by the Federal Reserve in 1929, Mr. Greenspan took steps to keep liquidity in the system to prevent this crash from spreading beyond the financial markets.
Response of the Federal Reserve
Tuesday, October 20, 1987: Shortly after the crash, the Federal Reserve decided to intervene to prevent an even greater crisis. Short-term interest rates were instantly lowered to prevent a recession and banking crisis. Remarkably, the markets recovered fairly quickly from the worst one day stock market crash. The Federal Reserve also worked with banks and securities firms to encourage the availability of credit to support the liquidity and funding needs of brokers and dealers. As noted earlier, the extension of credit by banks to the securities firms was key to the ability of these firms to meet their clearing and settlement obligations and to continue to operate in these markets.
One of the principal causes of the 1987 Stock Market Crash was Soaring Margin Debt -
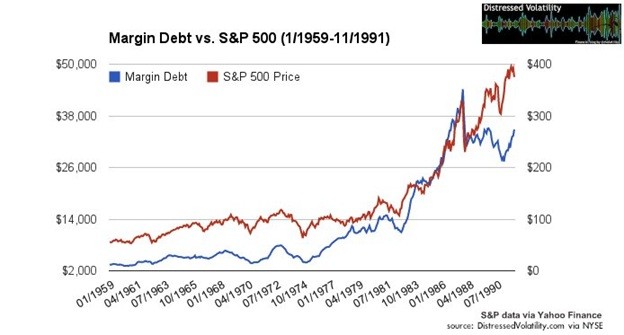
Look how the market immediately crashed nearly 23% when margin debt went vertical in 1987. Interestingly, the S&P500 actually peaked one month before margin debt did in 1987.
Today’s Astronomically Rising Margin Debt echoes 2014…Déjà vu 1987
History is testament that Record NYSE Margin Debt is the catalyst that can lead to another 1987-Like Stock market Crash…as it happened in 2000-2002 and 2007-2008. In this first bear period the S&P500 crashed -51%; and in the second bear correction S&P500 crashed -59%. See chart:
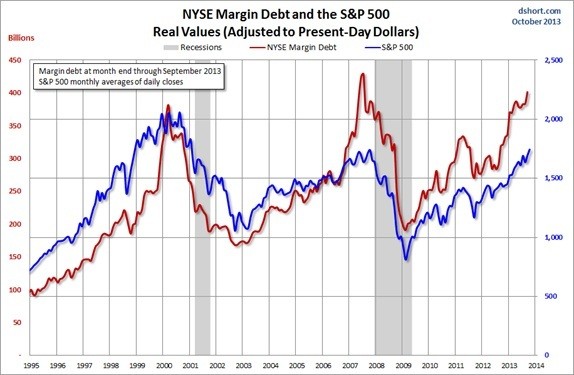
FAST-FORWARD TO 2013: Margin Debt Hits Record-High $401 Billion (November 7th, 2013)
Essentially, higher margin debt means the risks to the downside are increasing. While the equities market doesn’t necessarily have to sell off tomorrow, when it does happen, a higher level of borrowing will mean a faster descent.
This record level of margin debt is indeed a warning sign. Because the equities market has been pushed up by this additional flow of funds, any sign that investor sentiment is shifting will lead to a pullback in margin debt, and this leads to selling pressure in the equities market.
If these investors had adequate capital, they wouldn’t be borrowing money to put in the equities market. So when we see data showing a pullback among the investors who are the most leveraged, this will lead to large selling pressure.
But because the equities market is at such high levels with a record margin debt, this combination along with the shift in investor sentiment could lead to a significant and dramatic sell-off.
While timing the market is impossible from simply looking at margin debt, it is an additional warning sign. The record level of margin debt is an indication to me that we are closer to the end of this run in the equities market than the beginning.
A raging bear stock market looms on the horizon Protect your family by not being caught by this ravaging bear. Take shelter in various forms of precious metal investments with a view of preserving your family’s wealth.
Do I hear in the distance: “2014…Déjà vu 1987”
More from Gold-Eagle


