The opportunity in gold stocks ‘is as compelling as any we’ve seen in the history of the gold market’
NEW YORK (September 19) Gold has been on an absolute tear in 2024, hitting record high after record high and surpassing a price of $2,600 per ounce for the first time in history after the Fed shocked markets with a 50 bps rate cut. But as many precious metals investors can attest, gold stocks have been left behind.
“As we write, gold has surged past the $2,500 mark for the first time in history, an event that would seem to herald a golden age for gold stocks,” wrote analysts at Goehring & Rozencwajg. “Yet paradoxically, these stocks have seldom been cheaper. What underlies this dissonance, and what might it portend for the future?”
While gold has enjoyed a nice upward trend since 2015 and now trades more than 30% above its 2011 peak, gold equities “have failed to follow suit,” they noted.
“The NYSE Arca Gold Bugs Index (HUI), a benchmark for gold stocks, languishes at 312, more than 50% below its September 2011 high,” the analysts highlighted. “Even more striking, the HUI today is only 10% above its August 2016 level—when gold was a mere $1,300 per ounce. Meanwhile, the HUI’s earnings per share are expected to quadruple this year compared to 2016.”

As for the reason behind this disconnect between gold and gold equities, the analysts laid the blame on “interest rates and the behavior of central banks.”
“Since 2020, real U.S. 10-year interest rates have climbed from -0.40% to 2.1%,” they wrote. “Western investors, habituated to offloading gold in response to rising real rates, have acted predictably. From 2020 to 2024, gold ETFs shed 31 million ounces, or 25% of their holdings, as investors sold both bullion and equities. The largest gold stock ETF, the GDX, experienced consistent outflows amounting to nearly 20% of its assets.”
They highlighted that a similar trend has occurred during past cycles, noting that “between 2012 and 2015, as real rates rose from -0.20% to 0.80%, gold ETFs liquidated 36 million ounces.”
“Yet this rate hike cycle has a critical difference: for the first time in decades, central banks have emerged as significant buyers of gold,” they said. “Between 2020 and 2024, central banks accumulated an estimated 106 million ounces of gold, more than offsetting the liquidation by Western investors. Consequently, despite the sharp rise in real interest rates, gold has nearly doubled.”
While central banks have shown increasing demand for gold bars, they have little appetite for gold shares, the analysts said. “With no natural buyer to counteract Western selling, gold equities have been left in the dust, now trading at historically low valuations,” they added.
But the analysts believe this has created a prime opportunity for contrarian value investors.
“As contrarian value investors, we see extraordinary opportunity in this disparity and have been increasing our positions in gold equities,” they wrote.
They noted that one question that has come up time and again from concerned investors “is whether some fundamental change has occurred within the gold mining industry to justify this extreme undervaluation,” with some worried “that rising costs have eroded the profit margins that should have expanded with the rising gold price.”
“While comparing the HUI with gold is a useful exercise, it doesn’t capture the full picture of the gold mining sector’s underlying health,” they said. To help add greater clarity, Goehring & Rozencwajg “constructed a [hypothetical] index of six major gold producers: Newmont, Barrick, Harmony, Goldfields, and Agnico Eagle.”
“Together, these companies produce 17 million ounces of gold and hold 343 million ounces of proven reserves, giving them a combined reserve life of 20 years,” the analysts noted. “With a collective enterprise value of $130 billion, these companies represent nearly 40% of the entire industry. Crucially, they all have financial records dating back to at least 2000, allowing us to compare current undervaluation with past extremes.”
Amid the gold rollercoaster between 1980 and 1999 that saw gold lose 79% of its value as it fell from $850/oz to $252/oz, they noted that “The Barron’s Gold Stock Index (the precursor to the HUI) mirrored this decline, falling 84% before also bottoming in 1999.”
“In 1999, our six companies produced 12 million ounces of gold at an average cost of $200 per ounce,” they said. “With gold averaging $279 for the year, these companies generated a combined adjusted EBITDA of just $1 billion. Their combined net asset value (NAV), calculated using a discounted cash flow (DCF) model with a 10% discount rate and $292 gold price, was $9 billion, compared to an enterprise value of $15 billion, implying a multiple of 1.8x.”
At the same time, “the combined real option value of our six companies was nearly $18 billion, against an enterprise value of $15 billion, suggesting they traded at 0.80x their real option value,” they added, noting that calculating real option value is useful at market lows as investors tend to view a stock related to a commodity whose value is predicted to rise “as a series of call options.”
“Another useful measure is the enterprise value per ounce of proven reserve, compared to the gold price,” they said. “In 1999, the companies had 240 million ounces of proven reserves and a combined enterprise value of $15 billion, or $61 per ounce of proven reserve. This meant that investors could buy gold in the ground for just 23% of the spot price.”
In 2011, when the gold price increased eightfold to $1,900/oz, “The HUI index rose sixteen-fold from 38 to nearly 600, while the market capitalization of the industry surged from $5 billion to $253 billion,” they noted. “At the market’s peak in 2011, gold miners accounted for nearly 2% of the S&P 500, up from just 0.4% in 2002.”
“The six companies saw their enterprise value rise eightfold from $15 billion to $115 billion,” the analysts highlighted. “Was this justified? Their combined revenues increased eightfold – consistent with both the gold price and their enterprise value. Despite rising costs, EBITDA grew nearly sevenfold from $2 billion to $13 billion. Their NAV, as measured by DCF using a 10% discount rate and $1,600 gold price (the 2011 average) increased sixteen-fold from $10 billion to $160 billion, far outpacing the rise in their enterprise value. The companies’ real option value also surged. From $18 billion in 1999, their option value grew ninefold to $200 billion by 2011.”
But after the euphoria of 2011, market conditions got “brutal for gold stocks,” they said. “By late 2015, gold had dropped nearly 50% to $1,051 per ounce, and the HUI had plummeted 85%, from 635 to 104. The market capitalization of gold miners fell from $253 billion to just $54 billion, shrinking from 2% to 0.3% of the S&P 500.”
The equity value of the hypothetical index declined by 73% during this period, the analysts noted, “as production fell by nearly 20%, revenues by 40%, and costs rose by 22%.”
“The companies’ DCF valuation dropped by 65%, using a 10% discount rate and $1,160 gold price while their real option value halved,” they added. “By 2015, the companies’ enterprise value had dropped to $40 billion – equivalent to 70% of their DCF value and just 0.40x their real option value. With 275 million ounces of proven reserves, the enterprise value per ounce was $150, or 12% of the spot price.”
By the time the bear market ended in 2015, gold-related stocks faced “extreme undervaluation, providing an excellent opportunity for contrarian investors,” they said. “Indeed, over the next five years, gold stocks surged by 218%, far outpacing the S&P 500, which gained 75%, and even the tech-heavy Nasdaq, which rose by 146%.”
“Today, we find ourselves at a similar juncture,” the analysts said. “Gold has rallied from its 2015 low of $1,051 to an all-time high of [$2,600], while the HUI has risen from 100 to [319].”
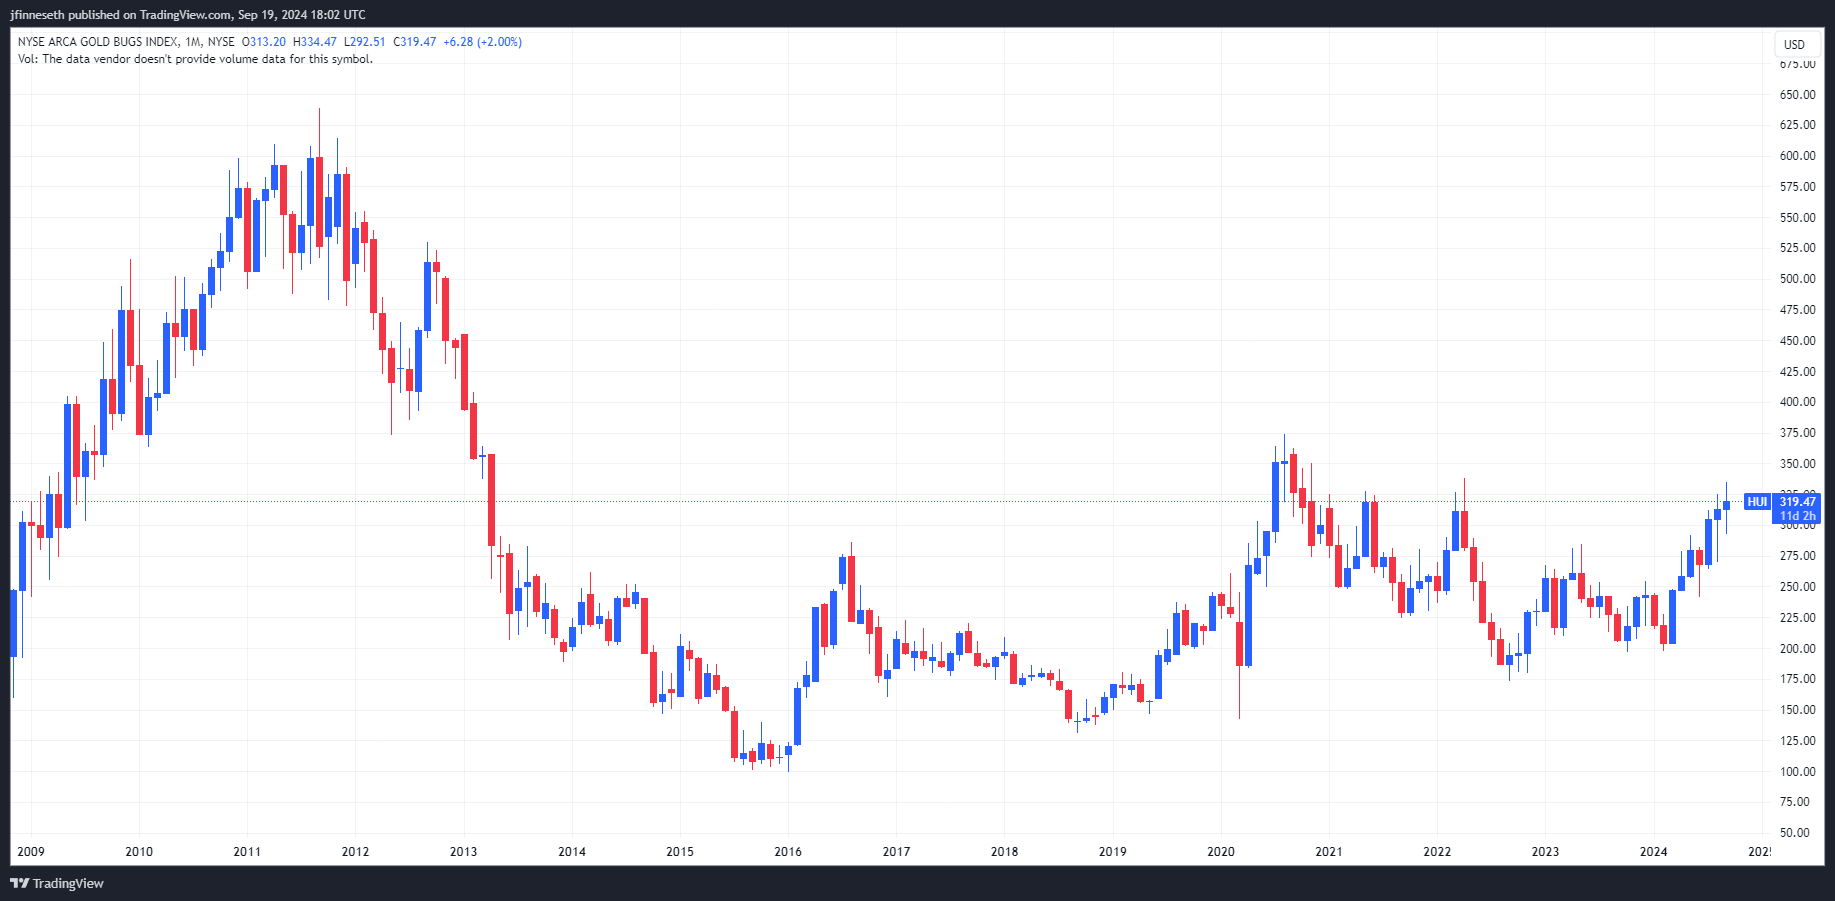
HUI Chart by TradingView
“Yet despite this, the market capitalization of gold miners remains at $220 billion, which is the same as it was in 2011 despite the fact that gold is 35% higher and the S&P 500’s market capitalization is four times greater,” they said. “Gold stocks now make up just 0.50% of the S&P 500, a figure reminiscent of the market bottom in 2015 rather than speculative tops.”
For the six companies in the index, their enterprise value has grown by 150% since 2015, their production has increased by 10%, revenues have doubled, and EBITDA has grown sixfold, the analysts noted. “Their NAV has tripled, using a 10% discount rate and $2,200 gold price, and their real option value has risen by a similar magnitude.”
“Despite this, they currently trade at just 0.60x their DCF value and 0.38x their real option value – levels not seen since 1999,” they pointed out. “At the most extreme reading earlier this year, these companies were valued at just $292 per ounce of proven reserve, or 12% of the spot price – again, the lowest on record.”
“By April 2024, gold stocks were as cheap as they have ever been,” the analysts observed. “The only comparable period is the market bottom in 2015. However, unlike 2015, gold is now at an all-time high.”
“Back then, a value investor had to anticipate a rise in the gold price to justify an investment in gold equities,” they said. “That is not the case today. Moreover, in 2015, the industry’s profit margins were slim – just 12%. Today, they are nearly 40%. From an operational standpoint, the margin of safety is much greater now than it was in the past.”
For all of the above reasons, the analysts said that “gold equities today offer an unprecedented combination of low valuation and high potential return.”
“Normally, when a commodity reaches new highs, investor interest is intense and valuations are stretched,” they explained. “Yet in the case of gold stocks, investor interest remains muted. Even as gold has rallied, investors have continued to withdraw funds from gold equity ETFs, with $1.5 billion redeemed from the GDX thus far in 2024 – a testament to the widespread disinterest in the sector.”
“While recent gains in gold stocks may be attributed to short-covering rather than renewed enthusiasm, the underlying value proposition is clear,” the analysts concluded. “In an environment where gold is hitting new highs, yet gold equities remain deeply undervalued, astute investors should take note. The current opportunity is as compelling as any we’ve seen in the history of the gold market.”
KitcoNews


