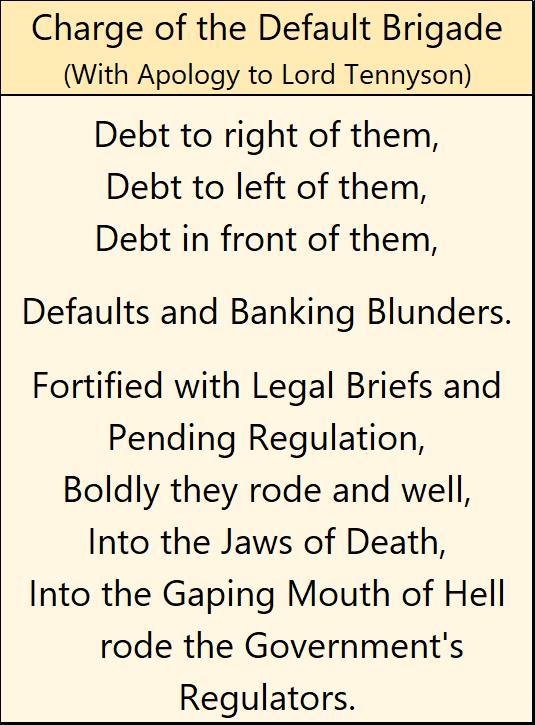
Into the Gaping Mouth of Hell


Do you like this week’s title above? I’m sure (hope) it catches lots of attention, but I admit it’s a bit of click-bate for this week. Still, it’s appropriate as a title, as you’ll discover further down in this week’s commentary. If Lord Tennyson can write things like that, then why can’t I rip him off? I don’t think I’ll get a letter of protest from him, he passed away 132 years ago.
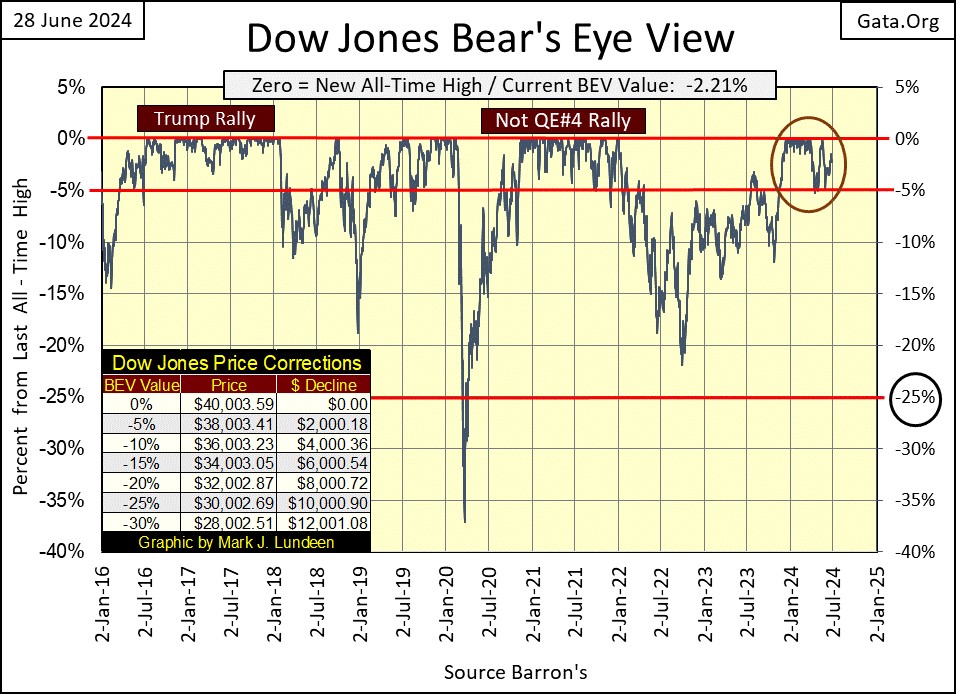
Next week is a good week to take off, as nothing exciting is happening in the stock market, as seen with my proxy for the broad stock market; the Dow Jones in its BEV chart below.
Within the circle, the Dow Jones has been in scoring position since November 20th, where it soon began making new all-time highs (0.00% = BEV Zeros), the first of the advance on December 13th. By March 28th, it made twenty-four new all-time highs, taking the Dow Jones from 35,151 on November 20th, when it first closed above its BEV -5% line below, to 39,807 on March 25. That was a four month, 13.2% advance.
Following that, the Dow Jones declined to its BEV -5% line, for a 5% correction in mid-April, and has since traded between its BEV Zero, and BEV -5% lines, (aka; in scoring position) taking the Dow Jones to 40,003 on May 17th, the last, of its twenty-six new all-time highs of this advance; so far.
The above is a lot of words for something that can be easily seen below with a quick glance; since last November, the Dow Jones has been in scoring position, making twenty-six new BEV Zeros (new all-time highs) in the past seven months. As long as the Dow Jones remains in scoring position, one must assume additional new all-time highs in the Dow Jones will follow. What would change my mind on that? Seeing the Dow Jones close significantly below its BEV -5% line, especially should it close below its BEV -10% line.
Should that happen, get out and stay out of the stock market, unless the Dow Jones once again rises, and closes above its BEV -5% line. In other words, unless the Dow Jones is in scoring position in this BEV chart, for your own protection, get out and stay out.
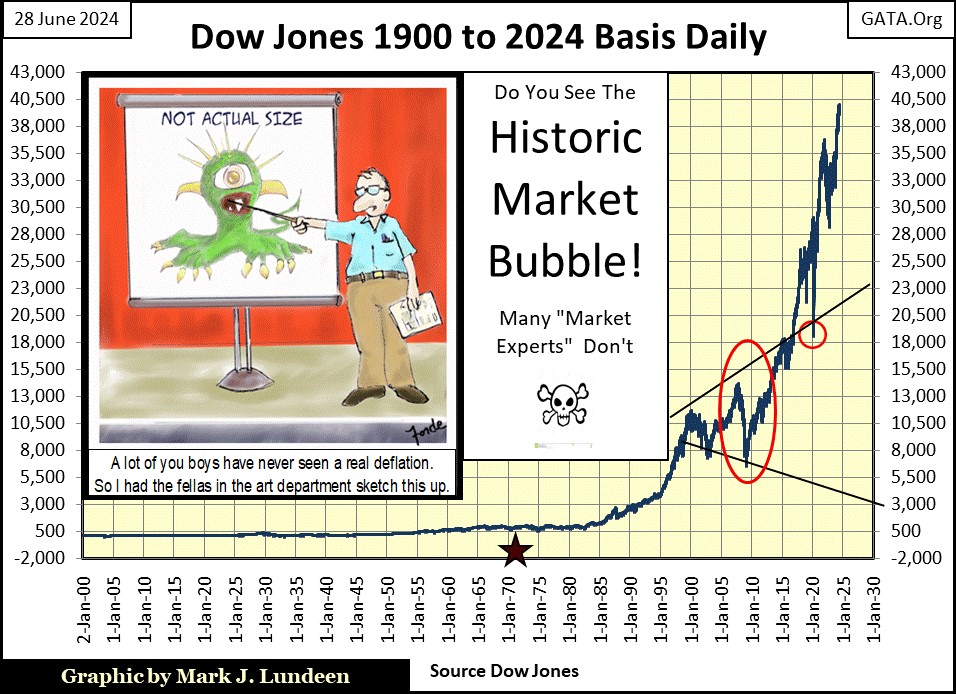
That is especially so, when one considers the massive top the stock market is currently in. So near to the top of the massive forty-two-year market bubble seen below, investments in this market have more exposure to massive-market risks, than any chance of an appropriate reward for assuming those risks.
When this bubble pops, maybe after the election, maybe before, there will be nothing but tears and misery, as the Dow Jones’ collapses to its ultimate bear market bottom. It’s just a sad fact of market history; bull-market bliss is never gained by buying at the top of an exponential curve, like the one seen below.
This is actually a very frightening chart. If someone is buying stocks with the intent of “holding them for the long term,” at this late stage of this massive bull market, there is only one cure for that market psychoses; the one Mr Bear has in mind for them.
But in late June 2024, were not yet at the top of this market bubble. There are still crumbs for the bulls to gather on the floor of the NYSE. At week’s close, the Dow Jones closed half way between its last all-time high, and its BEV -5% line in the daily bar chart below. So, what is to come? Another new all-time high, or a close below the BEV -5% line?
Looking at this chart, since March, 40,000 has proven to be a hard ceiling for the Dow Jones. And since January, 38,000 has also been good support in this market too. Whichever level the Dow Jones breaks through with authority, would be a clear short-term signal for what is to come in the stock market.
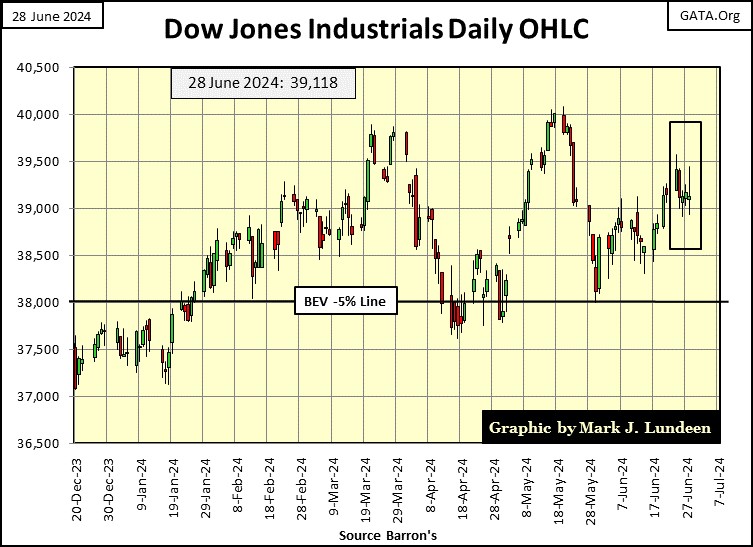
For myself, I’m short-term bullish, and will be for as long the Dow Jones remains in scoring position, in its BEV chart above. However, should the Dow Jones break above 40,000, and begin another series of BEV Zeros for this advance, I still think the stock market is a dangerous place for my money to be in.
The exception to that would be the gold and silver miners, a market sector that has traded as if it was in a depression for over a decade. That means the precious metal miners are cheap, and that is when prudent investors take a position in any market.
Next is my table for the major-market indexes’ BEV values I follow. The market saw some BEV Zeros on Thursday, but each week it seems we see fewer and fewer new all-time highs in the table below. The week closed with fourteen of these indexes closing in scoring position. That’s bullish.
I hate this market, a market that for the past four decades has been inflated into a grotesque financial bubble by a gaggle of idiots at the FOMC. Still, looking at the table below, I find it hard making a bearish case for this market. Of course, should (when) these indexes deflate below their BEV -10% levels, that will no longer be so.
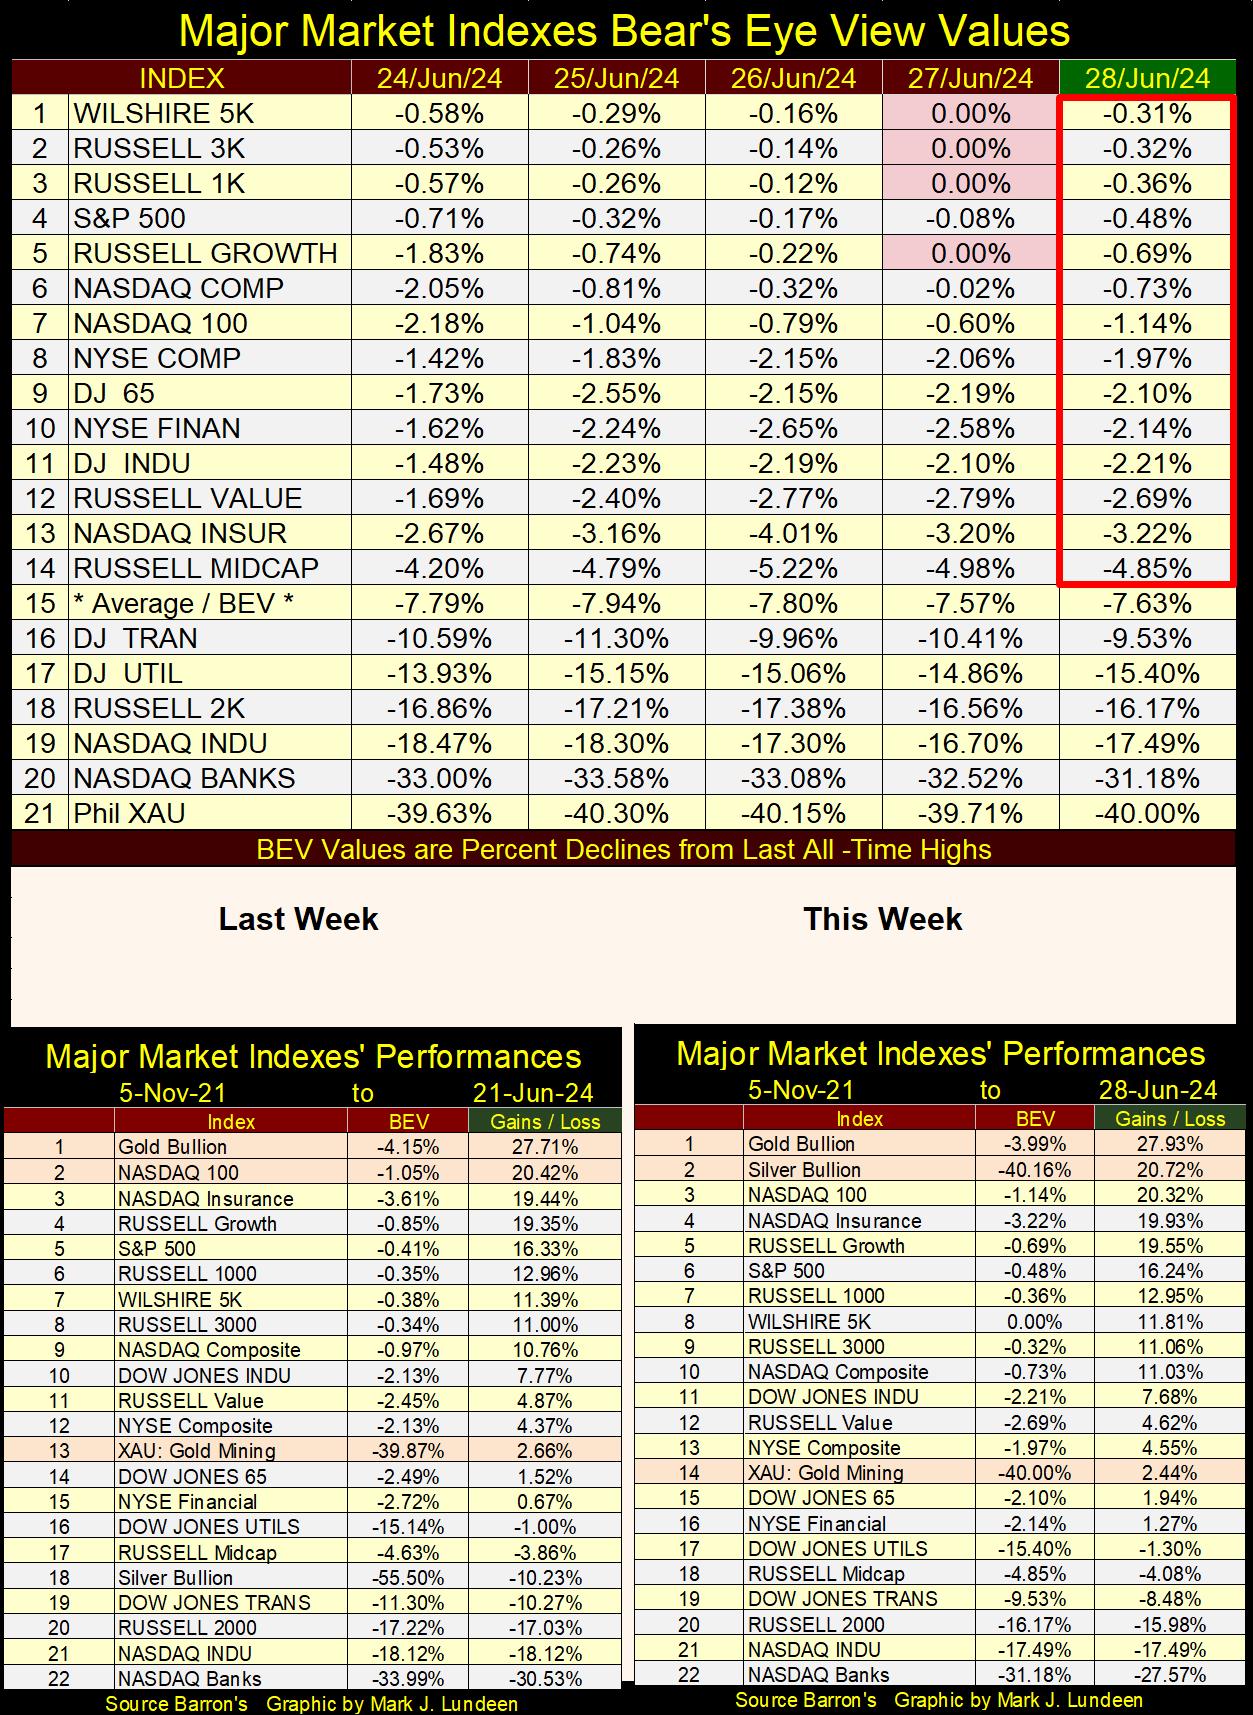
Not much changed this week in the performance tables above, so let’s look at #22 in the table above; the NASDAQ Banking Index’s BEV chart (below). The Bear’s Eye View (BEV) looks at the market as Mr Bear does;
- Each daily close at a new all-time highs = 0% (BEV Zero - a big fat zero, and never more),
- Daily closes NOT at a new all-time high = a negative percentage clawback from its last all-time high.
A BEV plot is a snap shot of the damage Mr Bear inflicted on the bulls during big market declines. For instance, at the bottom of the sub-prime mortgage debacle (March 2009), Mr Bear clawed back 65% from these banks’ last all-time high, as the mortgage bubble went bust. During the March 2020 flash crash, he clawed back over 50% from these banks in March 2020. Last year, when those banks in Silcone Valley failed (Red Circle), Mr Bear clawed back 50% for a second time in three years.
What kind of a world do we live in, where its banking system is so volatile? What’s the word I’m looking for – unstable?
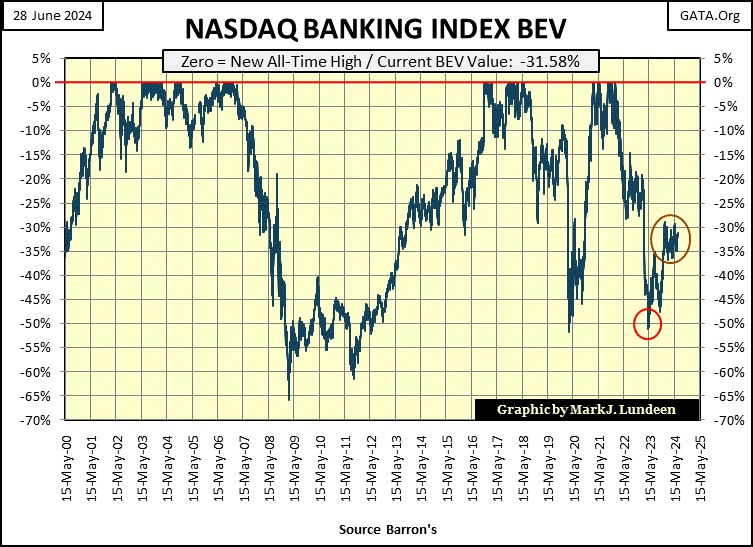
In the brown circle above, enclosing the market since January, the NASDAQ Banking Index has oscillated between its BEV -30% and -35% lines in its BEV chart. It seems the market is thinking hard about what lies ahead of these banks.
The day is coming when these banks are going to break out of this six-month trading range. A close above the BEV -25% line would be reassuring to the bulls. But a close below its BEV -40% line, I expect would signal a pending catastrophe for the stock market, and economy in general.
Why would that be? Because the banks are that important. They are the mechanism that enables cash to flow from buyers to sellers, around the world. If the banking system fails, for whatever reason, this flow of cash from buyer to seller ceases, and the economy goes into cardiac arrest. This was why there was a financial crisis in 2008-09, the global banking system was gagging on toxic mortgages. For that reason, global banking almost ceased to function as a conduit for cash flow, from buyer to seller.
Now, in June 2024, the banks have so many problems.
Is it just me, or does everybody else see shopping and office spaces in their world, that were occupied before the Covid fiasco (2019), that are now unoccupied? There are so many commercial spaces that I see unoccupied. These commercial spaces for the most part have mortgages on them. Since August 1971, isn’t that the purpose of real estate – to provide an excuse for the banking system to write mortgages on? I believe it is, making all those vacant commercial spaces, untold tens, maybe hundreds of billions of mortgages not being serviced.
As I’m driving around town, it seems like years since I saw a for-sale sign in front of a home. Rising mortgage rates have frozen the residential real estate market, in all fifty states. This isn’t good for the banks.
Then, what are these banks’ reserves? Since the Great Depression, banks no longer have reserves of gold and silver coins, but in instruments of debt, like mortgages and bonds.
Below is a T-bond, that since August 2020 has lost 44% of its market value (Blue Plot). It’s not just banks holding this garbage for reserves, so too are insurance companies, pension funds and trusts are loaded with this trash. As bond yields continue rising in the years to come, as they must, these bonds will only become ever more worthless, as an asset for anyone who owns them.
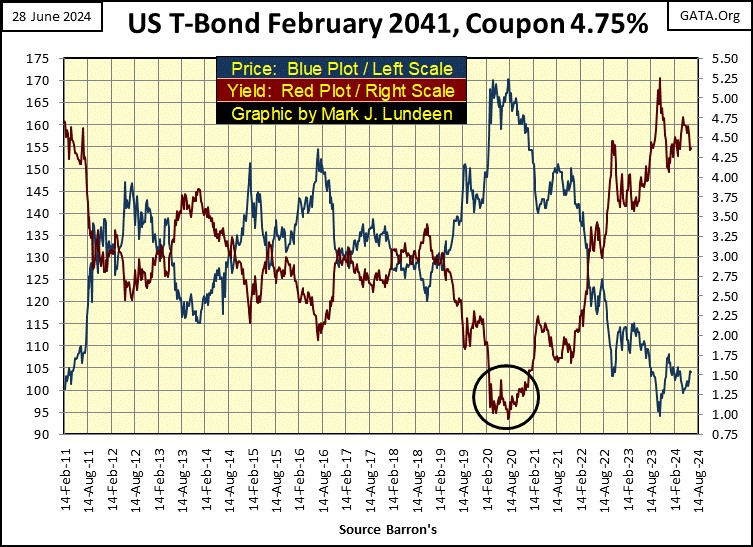
But what is seen above isn’t the real problem, only the consequence of having a bunch of Ivy-League idiots, managing anything Congress allows them to sink their meat-hooks into.
Who thought it was a good idea to drive long T-bond yields down below 1% in August 2020 (Red Plot above)? I can’t say it as a fact, but I suspect it was people, like those seen below, who not only thought 1% yields on 30Yr T-bonds was a good idea, but also made that happen.
I’m talking about people like these sixteen “Nobel Prize-winning economists” below, who are now warning about the inflationary impact of a second Trump term. They, and their ilk, had no problems with FOMC’s “monetary policy” that cause the collapse in bond yields, nor do they now object with its current “monetary policy” to fight CPI inflation.
As much as they hate Trump, these economists would love seeing a digital currency, controlled by the Federal Reserve. What a disaster that would be for the average human being on planet Earth.
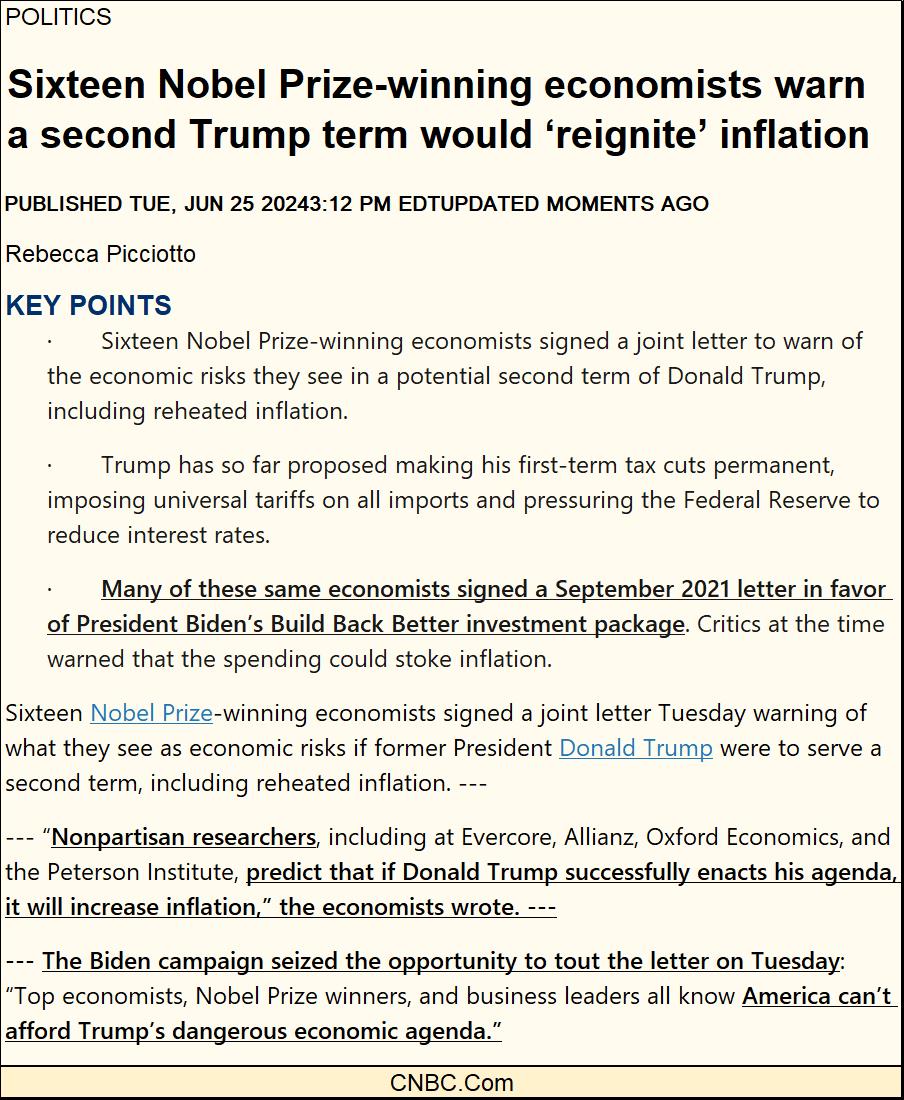
https://www.cnbc.com/2024/06/25/nobel-prize-economists-warn-trump-inflation.html
These Ivy-League idiots love informing the “unenlightened masses” of their august opinions, on this or that, or anything else on matters of “economic policy.” As seen above. But one thing they will never, ever show the public is the below long-term chart, in the growth of US Currency in Circulation (CinC). What did President Trump have to do with what is seen below; the real reason we have massive bubbles inflated in the financial markets, and now also rising CPI inflation.
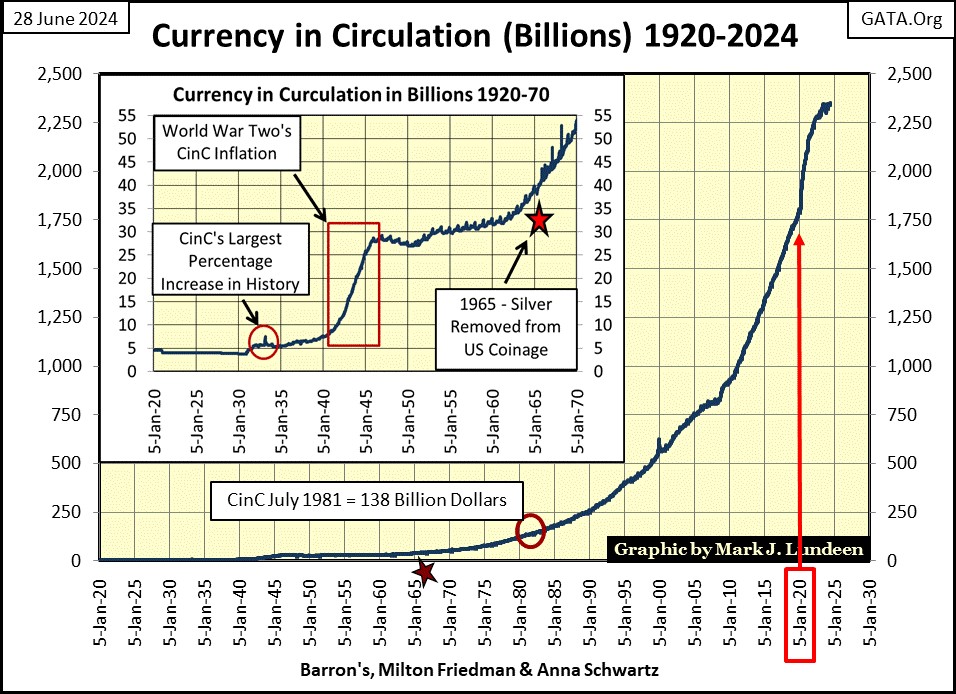
When was the last time you saw some idiot from Harvard or Princeton University, discuss the growth in the US National Debt, as seen below in the financial media? Like never, as they want to keep the public dumb about such things, and they, and the financial media have been very successful in keeping the public ignorant in this growth in debt.
How did long T-bond yields fall from 15.04%, in September 1981 as the national debt first broke above $1 trillion dollars, down to 1.20% in August 2020, as the national debt soared to over $26 trillion? With bond yields now rising, with the national debt (Treasury Debt Market) now over a nominal $34 trillion, this is a huge problem for the banking system. A problem made inevitable by “Nobel Prize Winning Economists.”
I don’t want to hear what these people think President Trump is going to do, should he win his second term in November. I want an apology from them, for what they have done to the US dollar; inflated it to near worthlessness. But I’m not holding my breath for it.
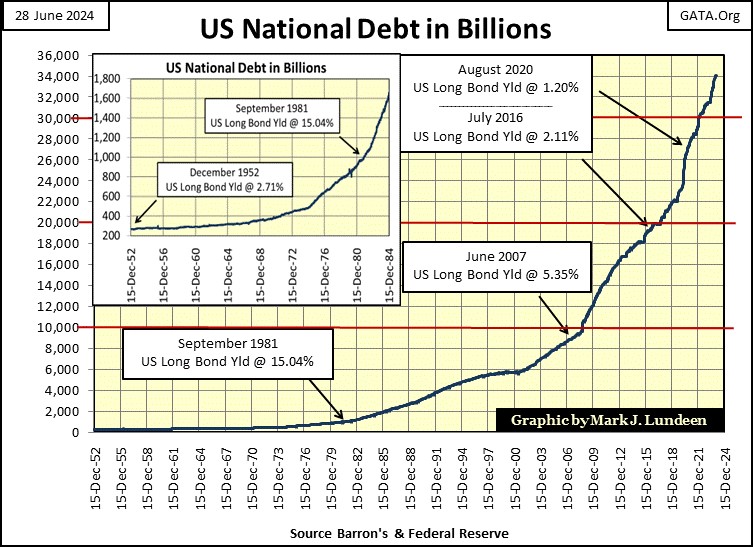
The chart above is just for the US national debt. This obscene increase in debt, made possible by the great Engine-of-Inflation; the Federal Reserve System, has occurred in all areas of the economy; local and state government, corporate and consumer. With rising rates and yields, problems will soon be at hand, and undeniable.
What’s to come of all this? There is no easy, painless solution to this problem. People’s lives will be destroyed, as shock waves of massive defaults from over-extended debtors become daily news, sometime in our uncertain future.
Way back when I was in grade school, I remember the nuns taught us Lord Tennyson’s Charge of the Light Brigade. What? Nuns taught students poems of war? The 1960s were a very different time than is now. Check it out on the internet, it’s a good poem. With slight modifications, verse III seems timely. Think of it as a poetic description of the bear market to come.
Below are the BEV values for the commodities I follow. With consumer price inflation being so high, its curious these commodities are so far from their last all-time highs. In time, these commodities will also be making new all-time highs (0% = new all-time high). What will CPI inflation be then?
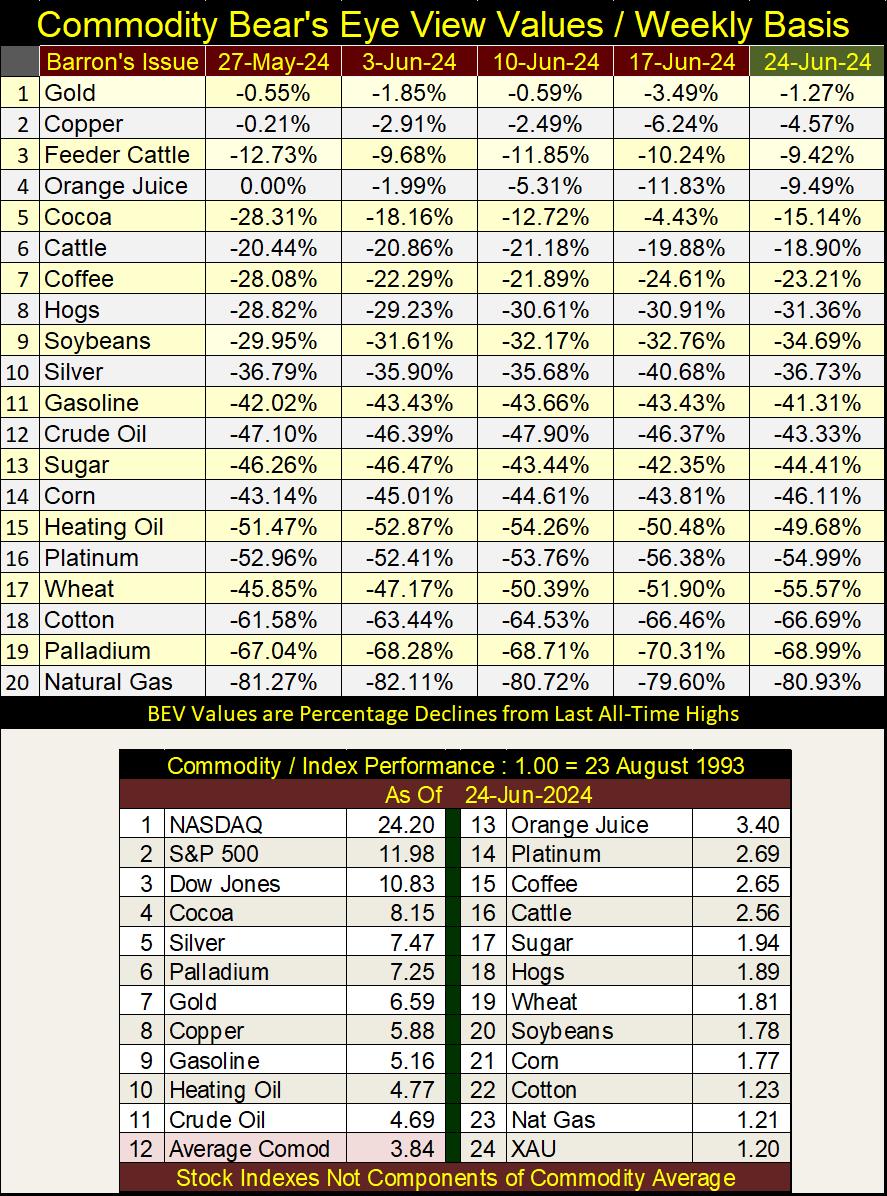
In the performance table above, the stock market indexes are in the top three positions, with the XAU (#24) at the bottom. But these indexes are based on 1.00 = 23 August 1993, which tells us where monetary inflation from the Federal Reserve has been flowing into for the past thirty-one years; into the stock market.
The day is coming when all that “liquidity” is going to come out of the stock market, and flow into commodity prices. It will take patience, but the XAU (gold and silver mining) is going to benefit greatly from this change in flow for monetary inflation. Until then, these miners of gold and silver are compelling bargains to be had in the stock market.
How compelling? Let’s look at the Barron’s Gold Mining Index (BGMI) performance since 2011 in the charts below. This week the BGMI closed at 955.93, far from its highs of 2011 (1635.01), or even from 1980 (1285.16).
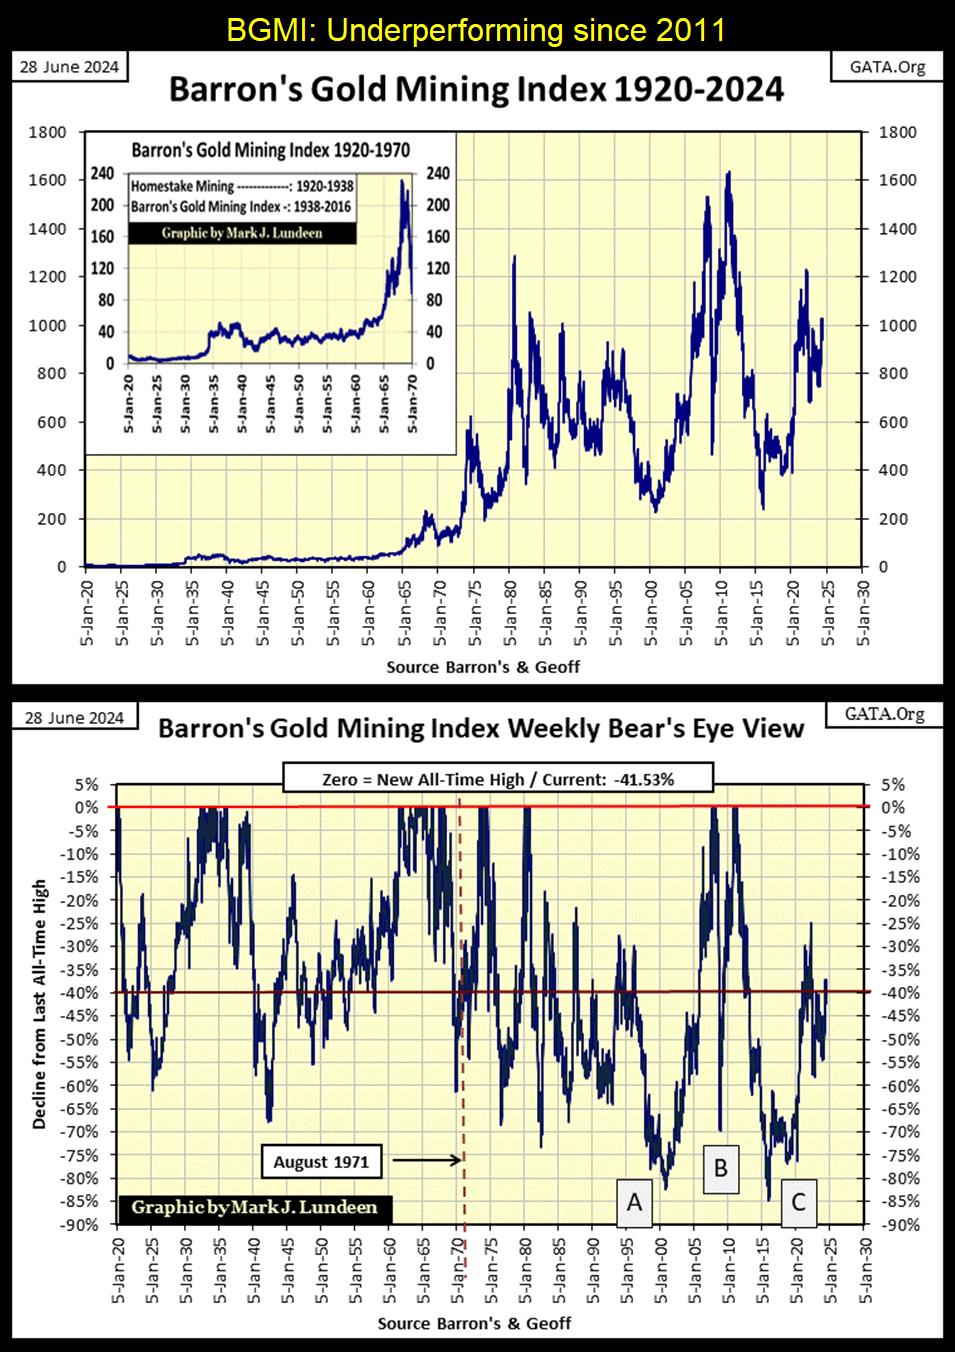
But plotting the BGMI in the dollars Barron’s published it in, fails to display what bargains these miners of gold and silver actually are. To better see the depressed valuation these gold and silver miners are now at, let’s look at the BGMI in BEV format above.
The bear market of 2011 to 2015 (Box C), was the deepest bear market bottom in gold mining for the 124 years of market history seen above; a Great Depression like, 85% market decline in the BGMI. A market decline that these miners have yet to recover from, as it’s been thirteen years, since the BGMI’s last BEV Zero, new all-time high in 2011.
So, if you want to avoid buying something overvalued, desiring instead to purchase something cheap, take a clue from the performance table and charts above; avoid what is in #1-3 in the above performance table, and focus on what is in #24.
Here is gold’s BEV chart. Market sentiment for gold is down, but gold still trades in scoring position. For that reason alone, I’m going to stay bullish on gold. But you know me well enough by now, to realize should gold deflate to its BEV -20% line, or even deeper, I would still not sell, and would want to buy more if I could.
And exactly why would that be? Maybe because, unlike those stupid government regulators above, who one day will charge into the Gaping Mouth of Hell as trillions of dollars of debt default, I really like gold, as gold, silver too, has zero counter-party risk. That doesn’t matter to most people; not today anyway. But one day it will, and they’ll then wish they had gold and silver.
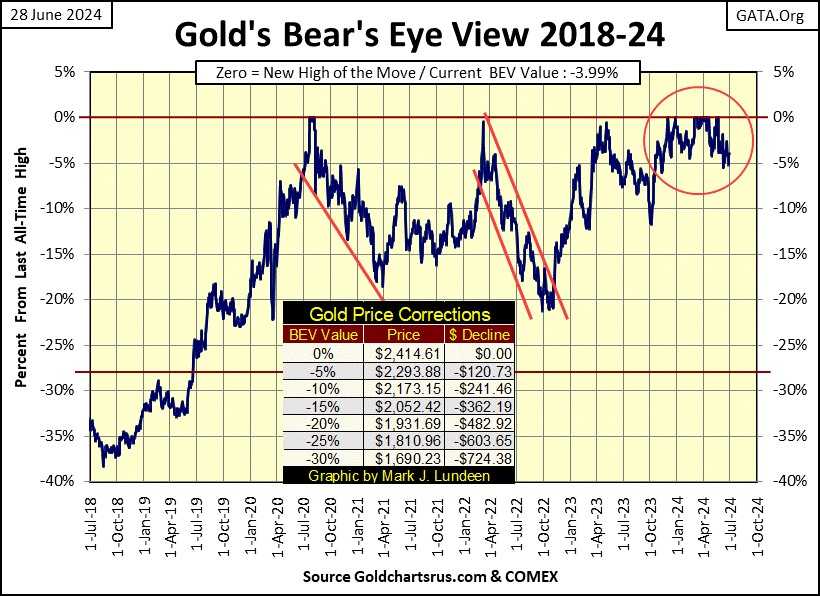
On gold’s side of the step sum table below, I highlighted in green the two days its BEV value fell below -4.99%, outside of scoring position. Note how on both occasions gold then snapped back nicely. Though gold hasn’t seen a new BEV Zero since May 21st, this is good market action for the bulls, and I’m expecting new all-time highs for gold in the not too distance future.
I note how since May 23rd, gold’s daily volatility’s 200D M/A has increased from 0.61%, to 0.67%. That isn’t much, but if the gold market is entering a new phase of rising valuations (new all-time highs), we should see daily volatility rise even higher, to something over 1.00%.
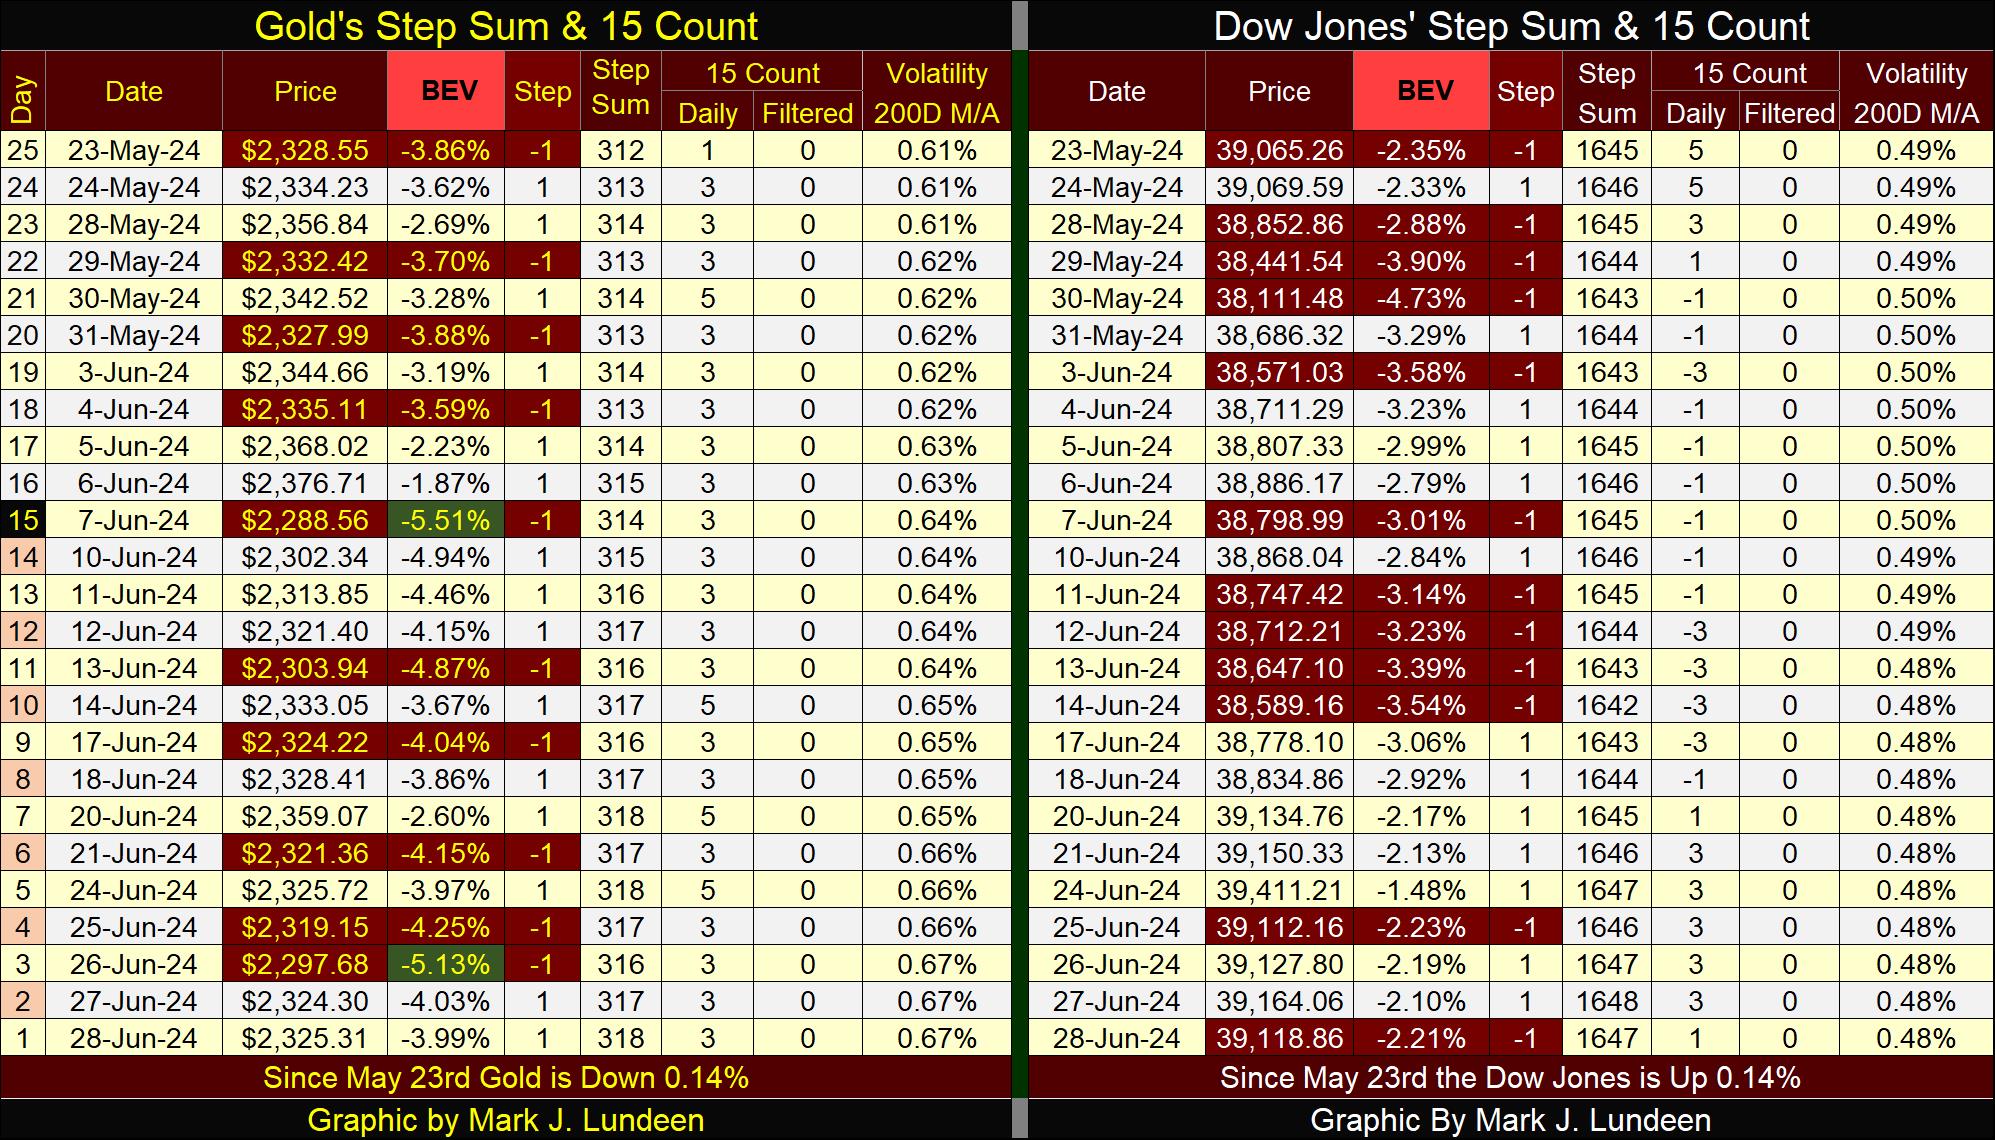
The Dow Jones on its side of the step sum table looks good too. In its daily trading, it continues closing inside of scoring position *AND* its daily volatility’s 200D M/A is going down, closing the week at 0.48%. Bull markets in the stock market are low volatility markets. Until daily volatility for the Dow Jones once again trends towards something over 1.00%, and the Dow Jones closes with a BEV value of something greater than -5%, and stays there for a week or so, I have to be a bull on the stock market.
The Good Lord willing, I’ll see you guys in two weeks!
Mark J. Lundeen
*********


