Gold Aware, Stocks Beware


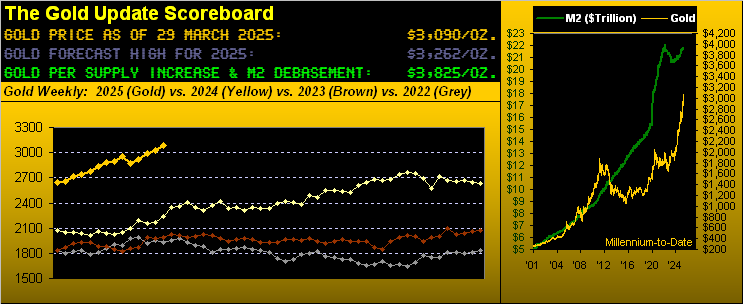
Well! Can we all say “Gold 3100!” After all, why stop at 3000? For this past Thursday as Gold’s contract volume rolled from April into that for June came +29 points of fresh price premium and (per Tag Team from ’93):  “Whoomp! There It Is!” as 3100 June Gold traded, indeed yesterday (Friday) to as high as 3124!
‘Course, from the “Nitty-Picky Dept.”, spot Gold didn’t quite get there, reaching up to only 3085, with the April contract going off the board at 3090. Yet given our year’s Golden Goal Three forecast high of 3262, (let alone the above Scoreboard’s Dollar debasement Gold valuation of 3825), ’tis merely a matter of time for spot 3100… and beyond!
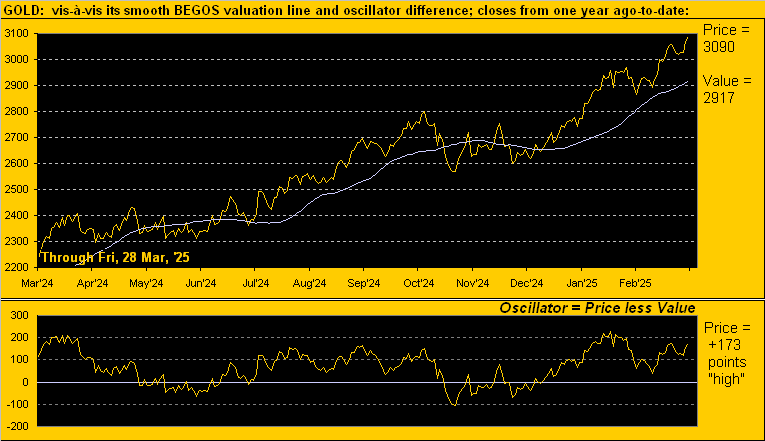
Regardless (and you knew this was coming): all the new-found Gold euphoria aside, yes, we remain expectant for some material degree of price decline. ‘Tis technically so by our BEGOS valuation of Gold depicting it as +173 points “high” (price then always reverting to valuation). ‘Tis fundamentally so by inflation’s inability to efface toward a “Fed-favoured” pace. Let’s have a look.
Technically we’ve our year ago-to-date chart of price’s daily closes vis-à-vis the smooth valuation line which assesses Gold’s movement relative to those of the four other primary BEGOS Markets, namely the Bond, Euro, Oil and S&P 500. As shown, Gold is presently priced at 3090, but the valuation line is 2917: thus we’ve the +173-point difference which will get closed, aided as well by the smooth line itself being on the rise:
Fundamentally for inflation through February, ’tis said you can “pick your poison” per our puke-green table below, wherein:
- Should you side with The Bureau of Labor Statistics (which calculates both the Consumer Price Index and Producer Price Index), the pace of inflation slowed for the month, the core PPI itself being deflationary;
- If instead to go with the Fed, The Bureau of Economic Analysis‘ Personal Consumption Expenditures data came in well-ahead of the Federal Reserve’s preferred annualized rate of +2.0%.
But: to average the six annualized measures for February, ’tis magically spot-on at +2.0% So if you’re an Open Market Committee member, query: Who to believe? What to do? Lower, maintain, or raise? (To be sure, ’tis FinMedia-verboten to even mention the phrase “Fed rate raise”). Yet what? No cut? Cue King Crimson crooner Greg Lake from ’69: “Confusion will be my epitaph…” as here’s the table:
Either way, Gold is the momentum play … or is it? There being but one trading day remaining in March, indeed in Q1, let’s see where the real year-to-date momentum is as the Metals Triumvirate still tops our BEGOS Markets Standings, the podium placers being the red metal (+27%), the white metal (+19%) and the yellow metal (+17%) “Got inflation?” Gold aware, stocks beware: look at last place. Here’s the whole bunch:
“But with Copper making all-time highs, isn’t that great for the economy, mmb?”
Traditionally, Squire, Copper is said to lead the economy. ‘Course with “TT” (“Trump Tariffs”) dominating the newsflow, Copper naturally gets a surge, initially as a negative given it can increase inflation’s pace, but perhaps more broadly as a positive should manufacturing materially return StateSide and elicit higher real Gross Domestic Product. But definitely mind Copper as it does tend to lead the price of Gold, the red metal having fallen these last two days in-a-row.
As for the noted cellar-dweller in the above Standings, we’ve the S&P 500 -5% year-to-date. You may well have read that oft-dubitable Goldman Sachs just reduced their year-end S&P target to 6200. “Ahh, youth!” Our sense is to replace their “6” with a “4”. Still to their credit, that post-COVID $7T continues to slosh about … but are equities finally losing their “only game in town” status? For those of you scoring at home: annualized, the riskfull S&P yield is now 1.368%; the riskless three-month U.S. T-Bill’s is now 4.188%. Even those WestPalmBeachers down there can discern which is better; (well, maybe not…)
“But, mmb, the Bipartisan Policy Center just said the ‘X-Date’ for Treasury default is July-October…”
Squire loves welcoming Wall Street to real life. And welcome to Treasury, Scott “This we got” Bessent.
Really real life is enjoying Gold about to complete its tenth winning month of the past 13. On a mutually-exclusive basis, 10 wins out of 13 has occurred but three other times so far this century. And by the week from a year ago-to-date, below is our graphic of the enduring Gold streak. Therein, just 18 weeks have been down whilst basically double that — 35 — have been up. Here’s the Long and Short of it:
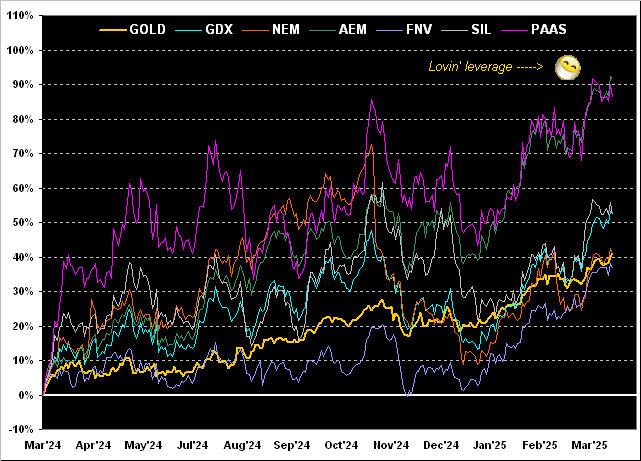
And in keeping with our month-end mode, let’s next look at leverage via the year-over-year graphic for the Golden percentage tracks of Gold & Bros. From low-to-high, there’s Franco-Nevada (FNV) +37%, both Gold itself and Newmont (NEM) +41%, the Global X Silver Miners exchange-traded fund (SIL) +52%, the VanEck Vectors Gold Miners exchange-traded fund (GDX) +53%, Pan American Silver (PAAS) +86%, and Agnico Eagle Mines (AEM)+92%. Too, a magnificent charter reader has asked we give special mention to Alamos Gold (AGI) aka “The Agnico of the Mid-Tiers” which +84% year-over-year would be tucked in just below AEM and PAAS. “Remember the Alamos!”
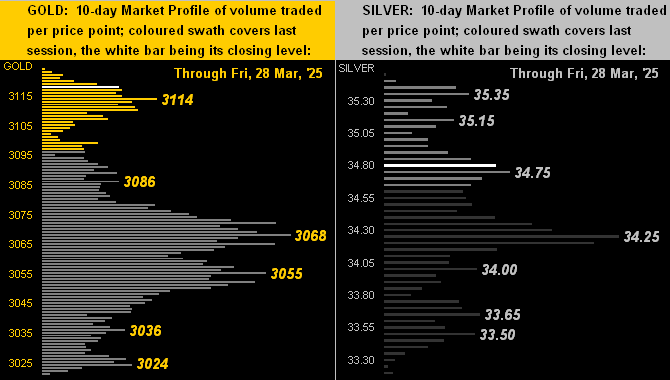
Near-term for the precious metals, these are their 10-day Market Profiles featuring Gold on the left and Silver on the right. Notable volume apices of the past fortnight are as labeled, the yellow metal (quoted by the June contract) showing support initially at 3114, then more so in the 3068-3055 zone, whilst the white metal’s key supporters are 34.75 and 34.25:
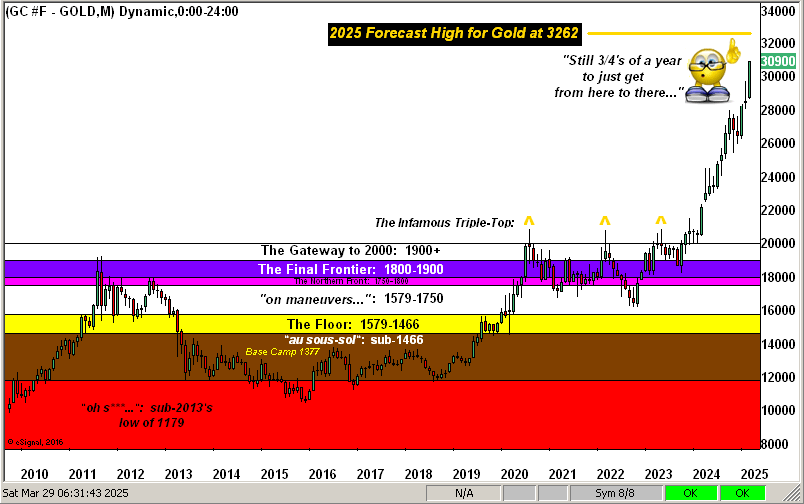
Broad-term for Gold we’ve the 16-year monthly candles across price’s structure. Remember the old trading axiom that “Triple tops are meant to be broken”? Oh my goodness…
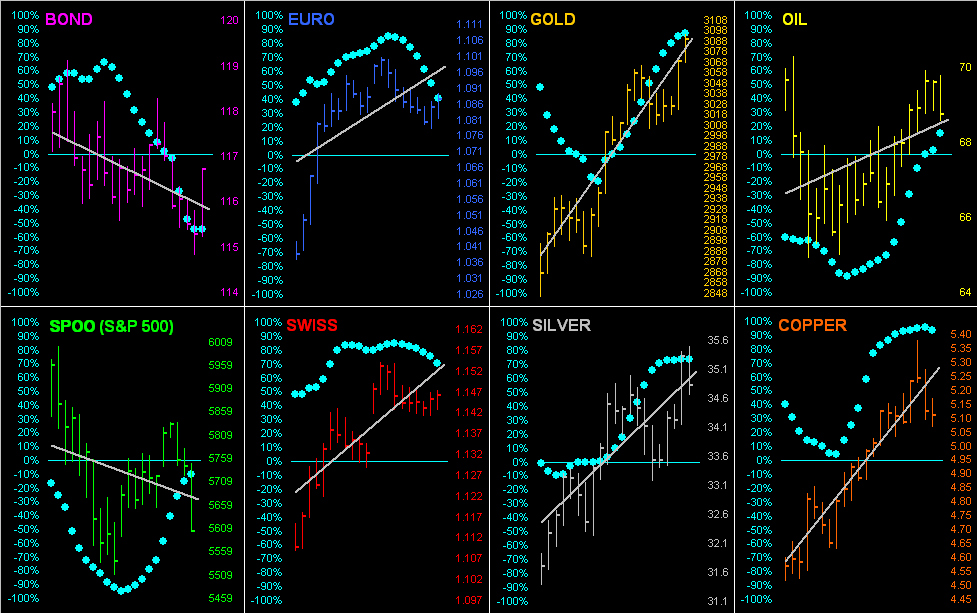
Thus it again being month-end, we go ’round the horn for all eight BEGOS Markets for the past 21 trading days (one month) along with their grey trendlines and baby blue dots depicting the day-to-day consistency of each trend. And yields having been a bit on the rise find the Bond’s price in recent demise, albeit gaining a safe-haven Friday bid as the S&P 500 fell from the skies. Note, too, per the website’s Prescient Commentary a couple of weeks back when Oil was in the 65s that the “Baby Blues” were then heralding a run to the low 70s … et voilà:
So as tomorrow we slide EuroSide to summer hours, let’s close it out for this week with (yet another) shocking stat for the S&P 500. ‘Course, you regular readers know the two “ongoing-in-perpetuity” shocks of 1) the “live” price/earnings for the S&P now at 40.2x — yes, that’s after Friday’s -2.0% fall — and 2) the current market cap of the S&P now $49.1T versus a “readily available” M2 money supply of less than half that at $21.8T. (Is your brokerage preparing its IOUs?)
Here’s our next shock. Per the aforeshown BEGOS Markets Standings, again the worst year-to-date loser is the S&P -5.1%. If we regress by the day from New Year the track of the S&P’s closing price (which currently is 5581), and extrapolate such trend to year-end, the Index then first settles in the 4000s come 12 August, on track to finish the year -25% at 4386. This varies a bit from Goldman’s 6200, but we tend to notice little things like that.
Because we don’t forget big things like this:
Got Gold?
Cheers!
…m…
www.TheGoldUpdate.com
www.deMeadville.com
and now on “X”: @deMeadvillePro
********

Mark Mead Baillie has had an extensive business career beginning in banking and financial services for two years with Banque Nationale de Paris to corporate research for three years at Barclays Bank and then for six years as an analyst and corporate lender with Société Générale.
For the last 22 years he has expanded his financial expertise by creating his own financial services company, de Meadville International, which comprehensively follows his BEGOS complex of markets (Bond/Euro/Gold/Oil/S&P) and the trading of the futures therein. He is recognized within the financial community of demonstrating creative technical skills that surpass industry standards toward making highly informed market assessments and his work is featured in Merrill Lynch Wealth Management client presentations. He has adapted such skills into becoming the popular author each week of the prolific “The Gold Update” and is known in the financial website community as “mmb” and “deMeadville”.
Mr. Baillie holds a BS in Business from the University of Southern California and an MBA in Finance from Golden Gate University.


