Gold: The Rally is Likely to Continue


Review
Starting from a low of USD 2,353 on July 25th, gold has been able to push further upwards over the past four weeks. Last Friday, spot gold prices climbed above the magical USD 2,500 mark for the first time. The bulls carried this momentum into the first half of this trading week, resulting in a new all-time high of USD 2,531 on Tuesday.
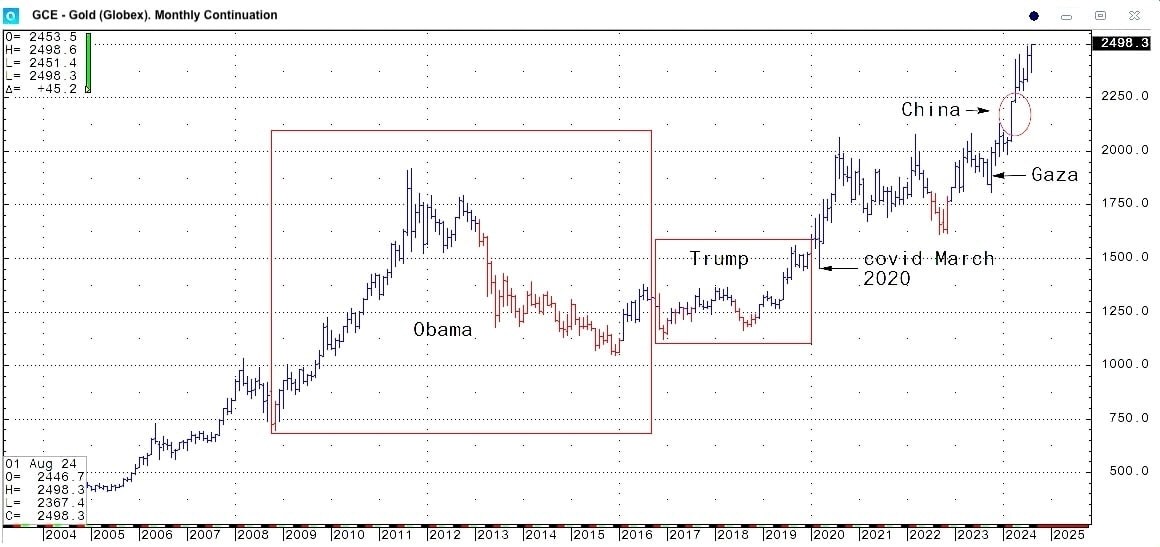
Gold in US-Dollar, monthly chart as of August 18th, 2024. Source: Alyosha
In addition to the still intact upward trend, ongoing geopolitical tensions in the Middle East, the escalating conflict between Ukraine and Russia, and expectations of possible interest rate cuts by the US Federal Reserve have contributed to rising prices. Geopolitics have played a crucial role since early October, leading to increased demand for gold as a safe haven.
Within the stable upward trend, gold prices experienced a sharp pullback at the beginning of August as they plummeted by over 4.5% from USD 2,477 down to USD 2,364 in less than 24 hours during the carry trade crash in Japan. However, like the stock markets, gold prices quickly recovered from this shock. Unlike the stock markets and Bitcoin, gold continues to reach new all-time highs, demonstrating impressive strength.
Chart Analysis – Gold in US-Dollar
Weekly chart: Final exaggeration yet to come
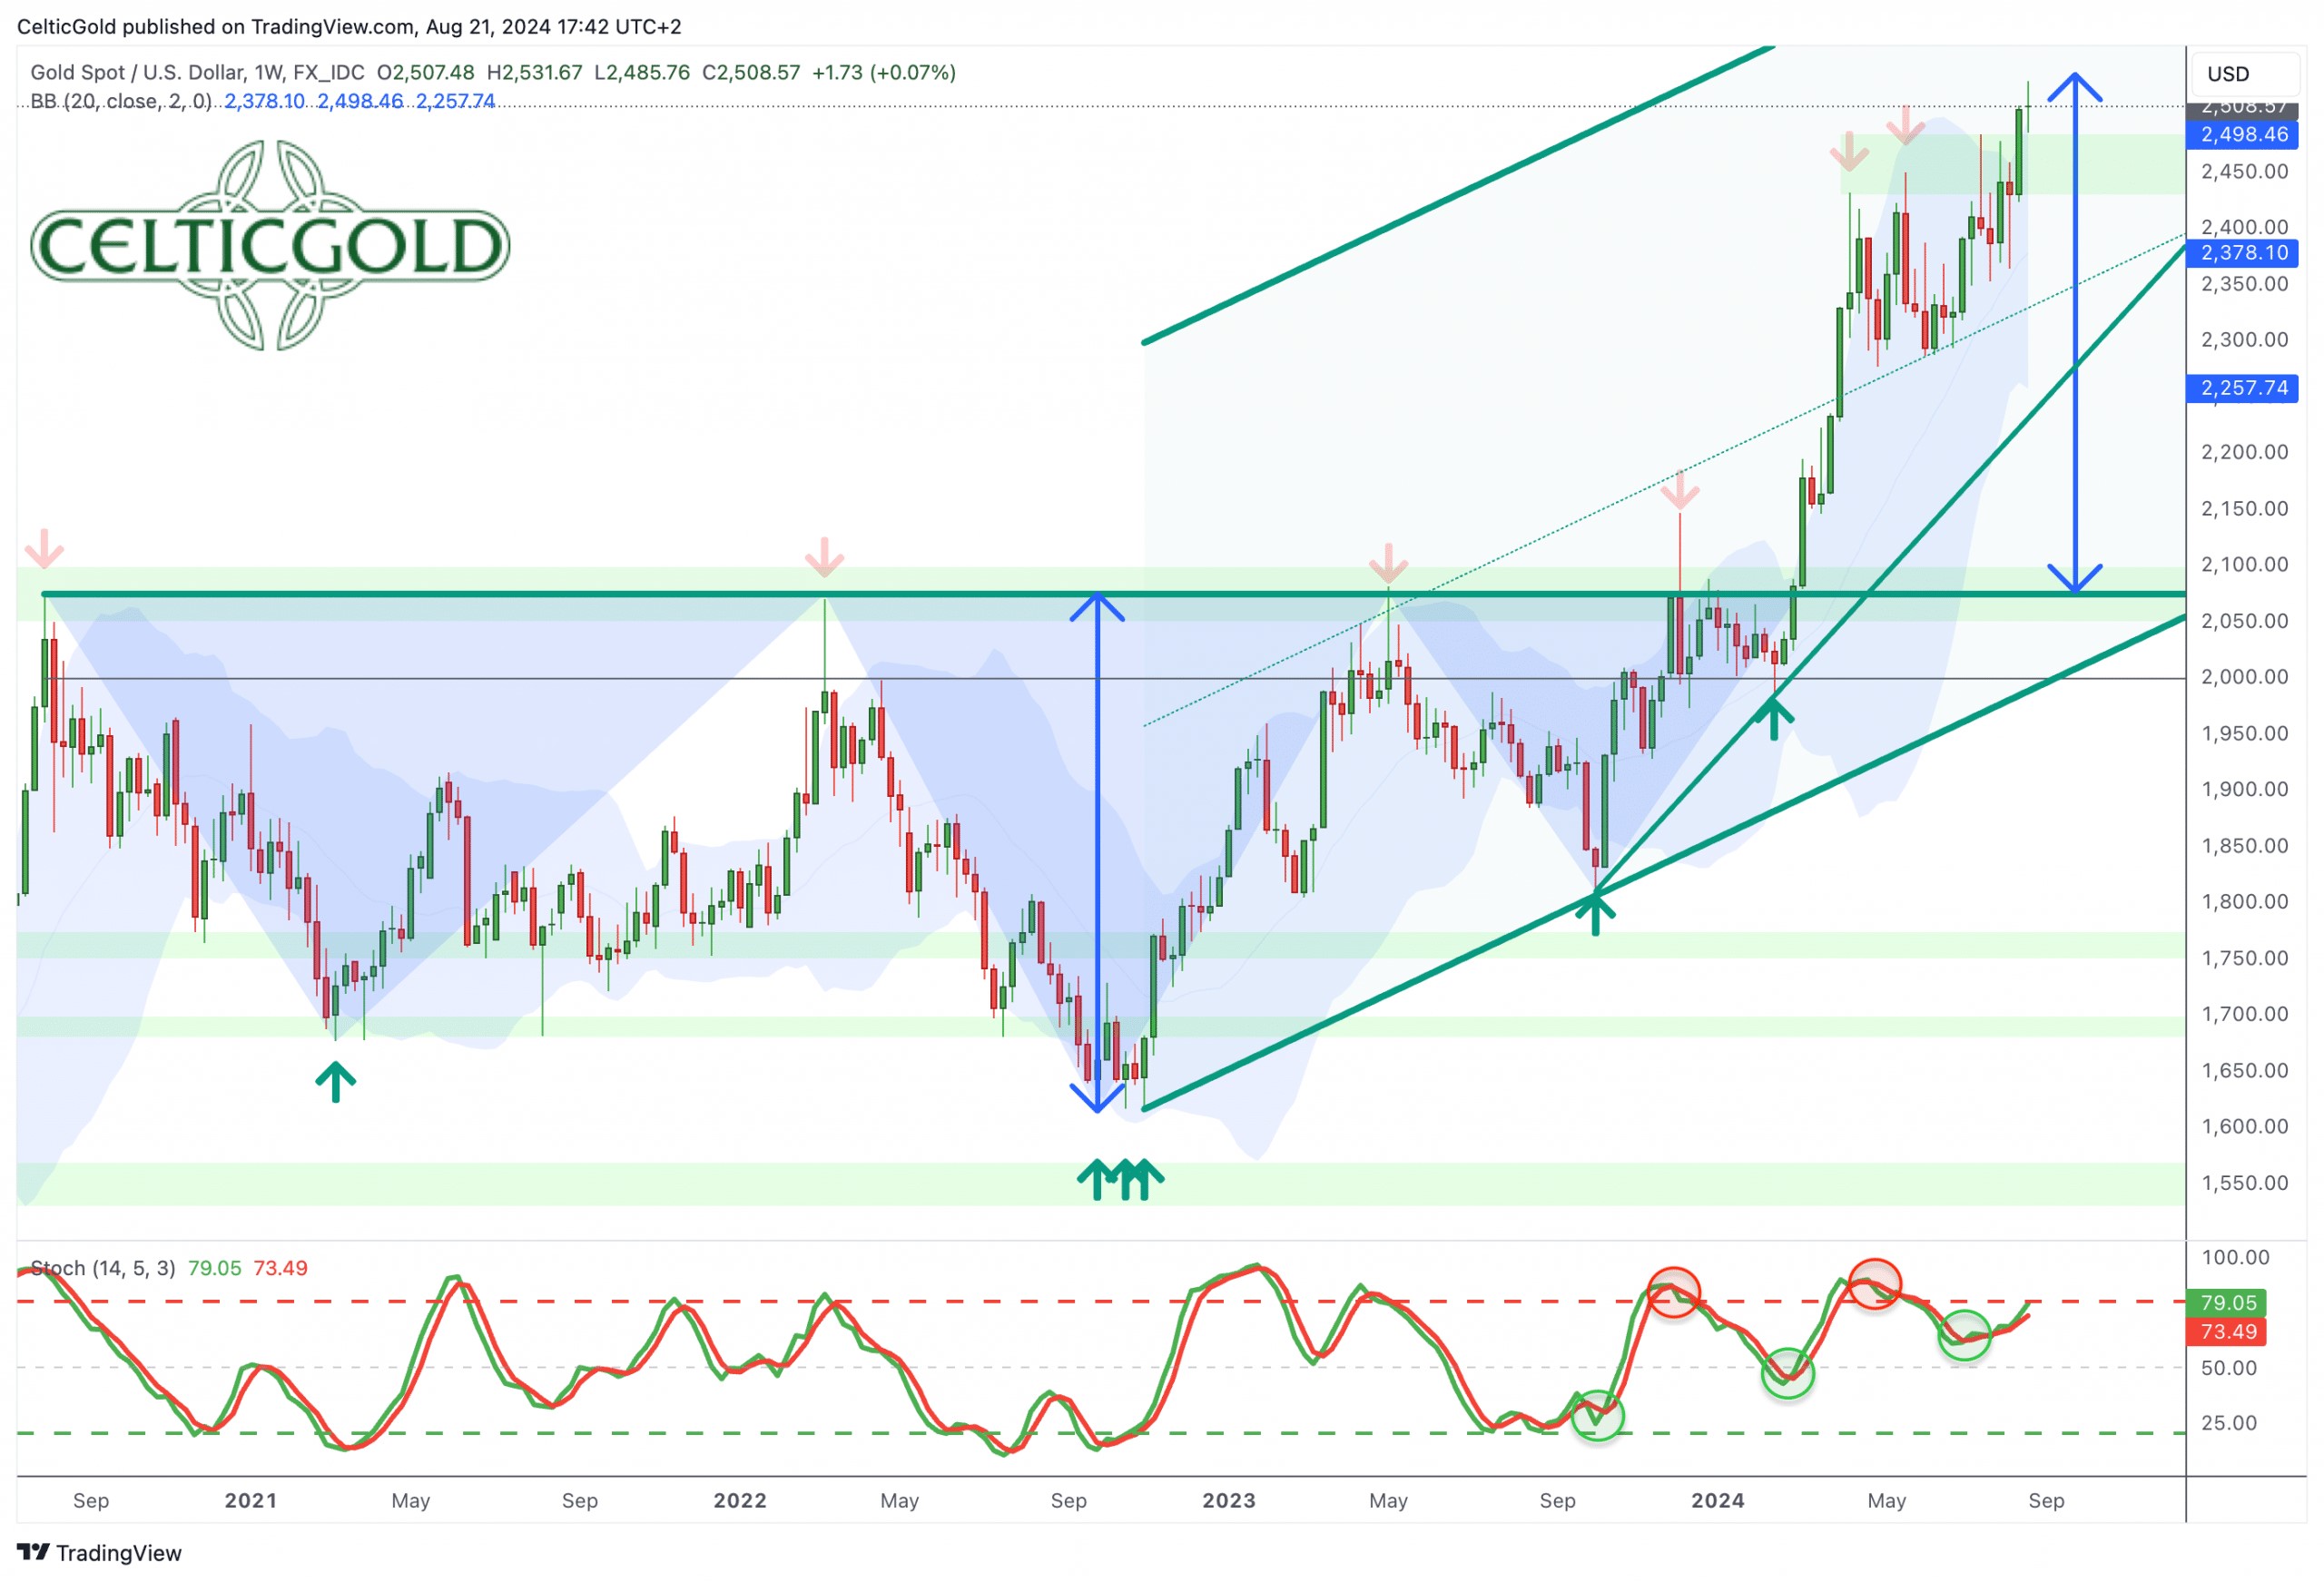
Gold in US-Dollar, weekly chart as of August 23rd, 2024. Source: Tradingview
In November 2023, based on the inverted head and shoulders formation, we set an initial target of USD 2,535 for the breakout rally in the gold market. Although the path was far from straightforward and easy, gold prices nearly reached our target with a new all-time high at USD 2,531 on Tuesday. The two tough sideways consolidations between December and February, and between mid-April and mid-August, made life difficult for trend followers, but the breakout above USD 2,500 could now signal a clear trend phase.
The breakout above the upper Bollinger Band (USD 2,498) on the weekly chart suggests more or less immediate new upward potential. In any case, the bulls are pushing this strong resistance upwards, so gold prices could indeed continue to rise in the coming weeks. As well, the stochastic oscillator supports this thesis with an active buy signal. The oscillator still has room before reaching the overbought zone.
Overall, the weekly chart is bullish and suggests higher gold prices in the coming weeks despite negative divergences. The fact that the rally, which started on October 6th, 2023, has not yet had an overshooting finale, suggests there might still be significant upward potential.
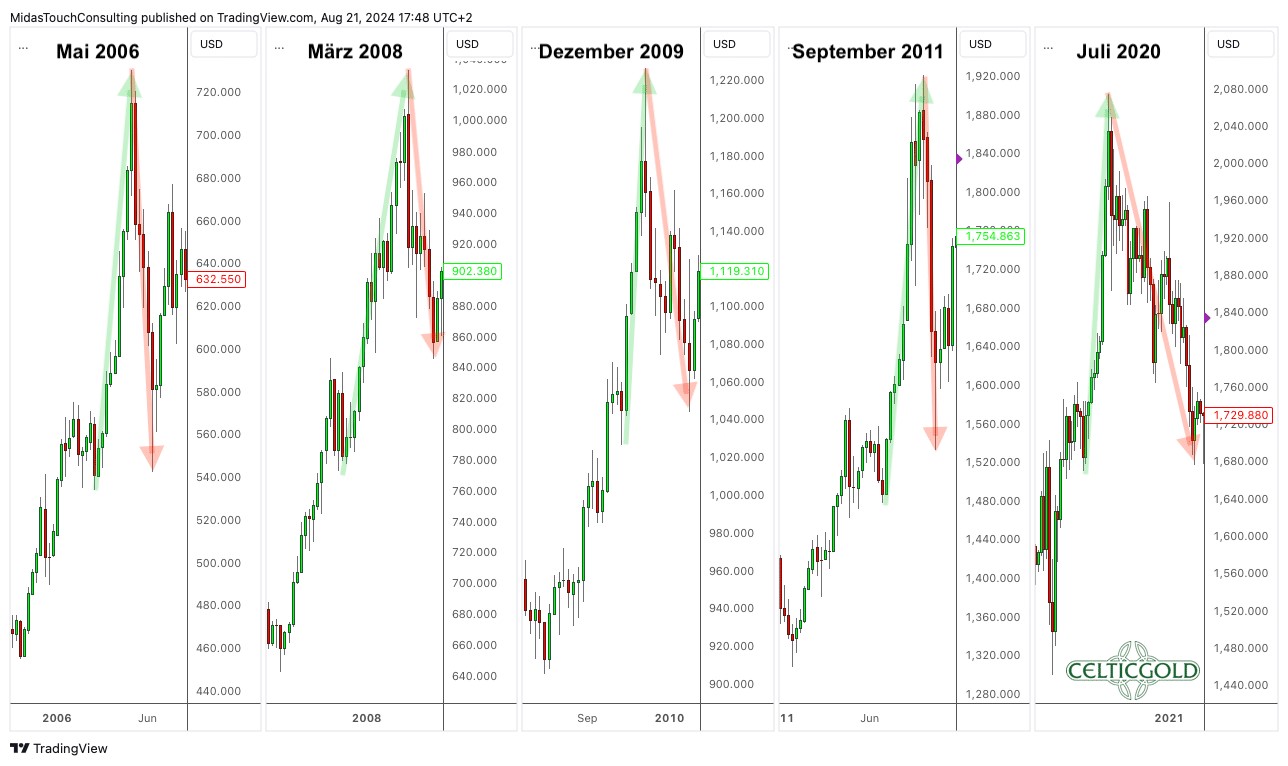
Gold price exaggerations in US-Dollar, daily chart as of August 21st, 2024. Source: Tradingview
Typically, months-long upward movements in the gold market have almost always ended with a vertical overshot, where the gold price could achieve enormous price increases in a short time. This was always followed by a brutal crash, where all gains from the final exaggeration phase were quickly lost. This pattern was observed in May 2006, March 2008, December 2009, September 2011, and July 2020, and is still missing from the rally that started in October 2023.
Daily chart: Stochastic oscillator bullishly embedded
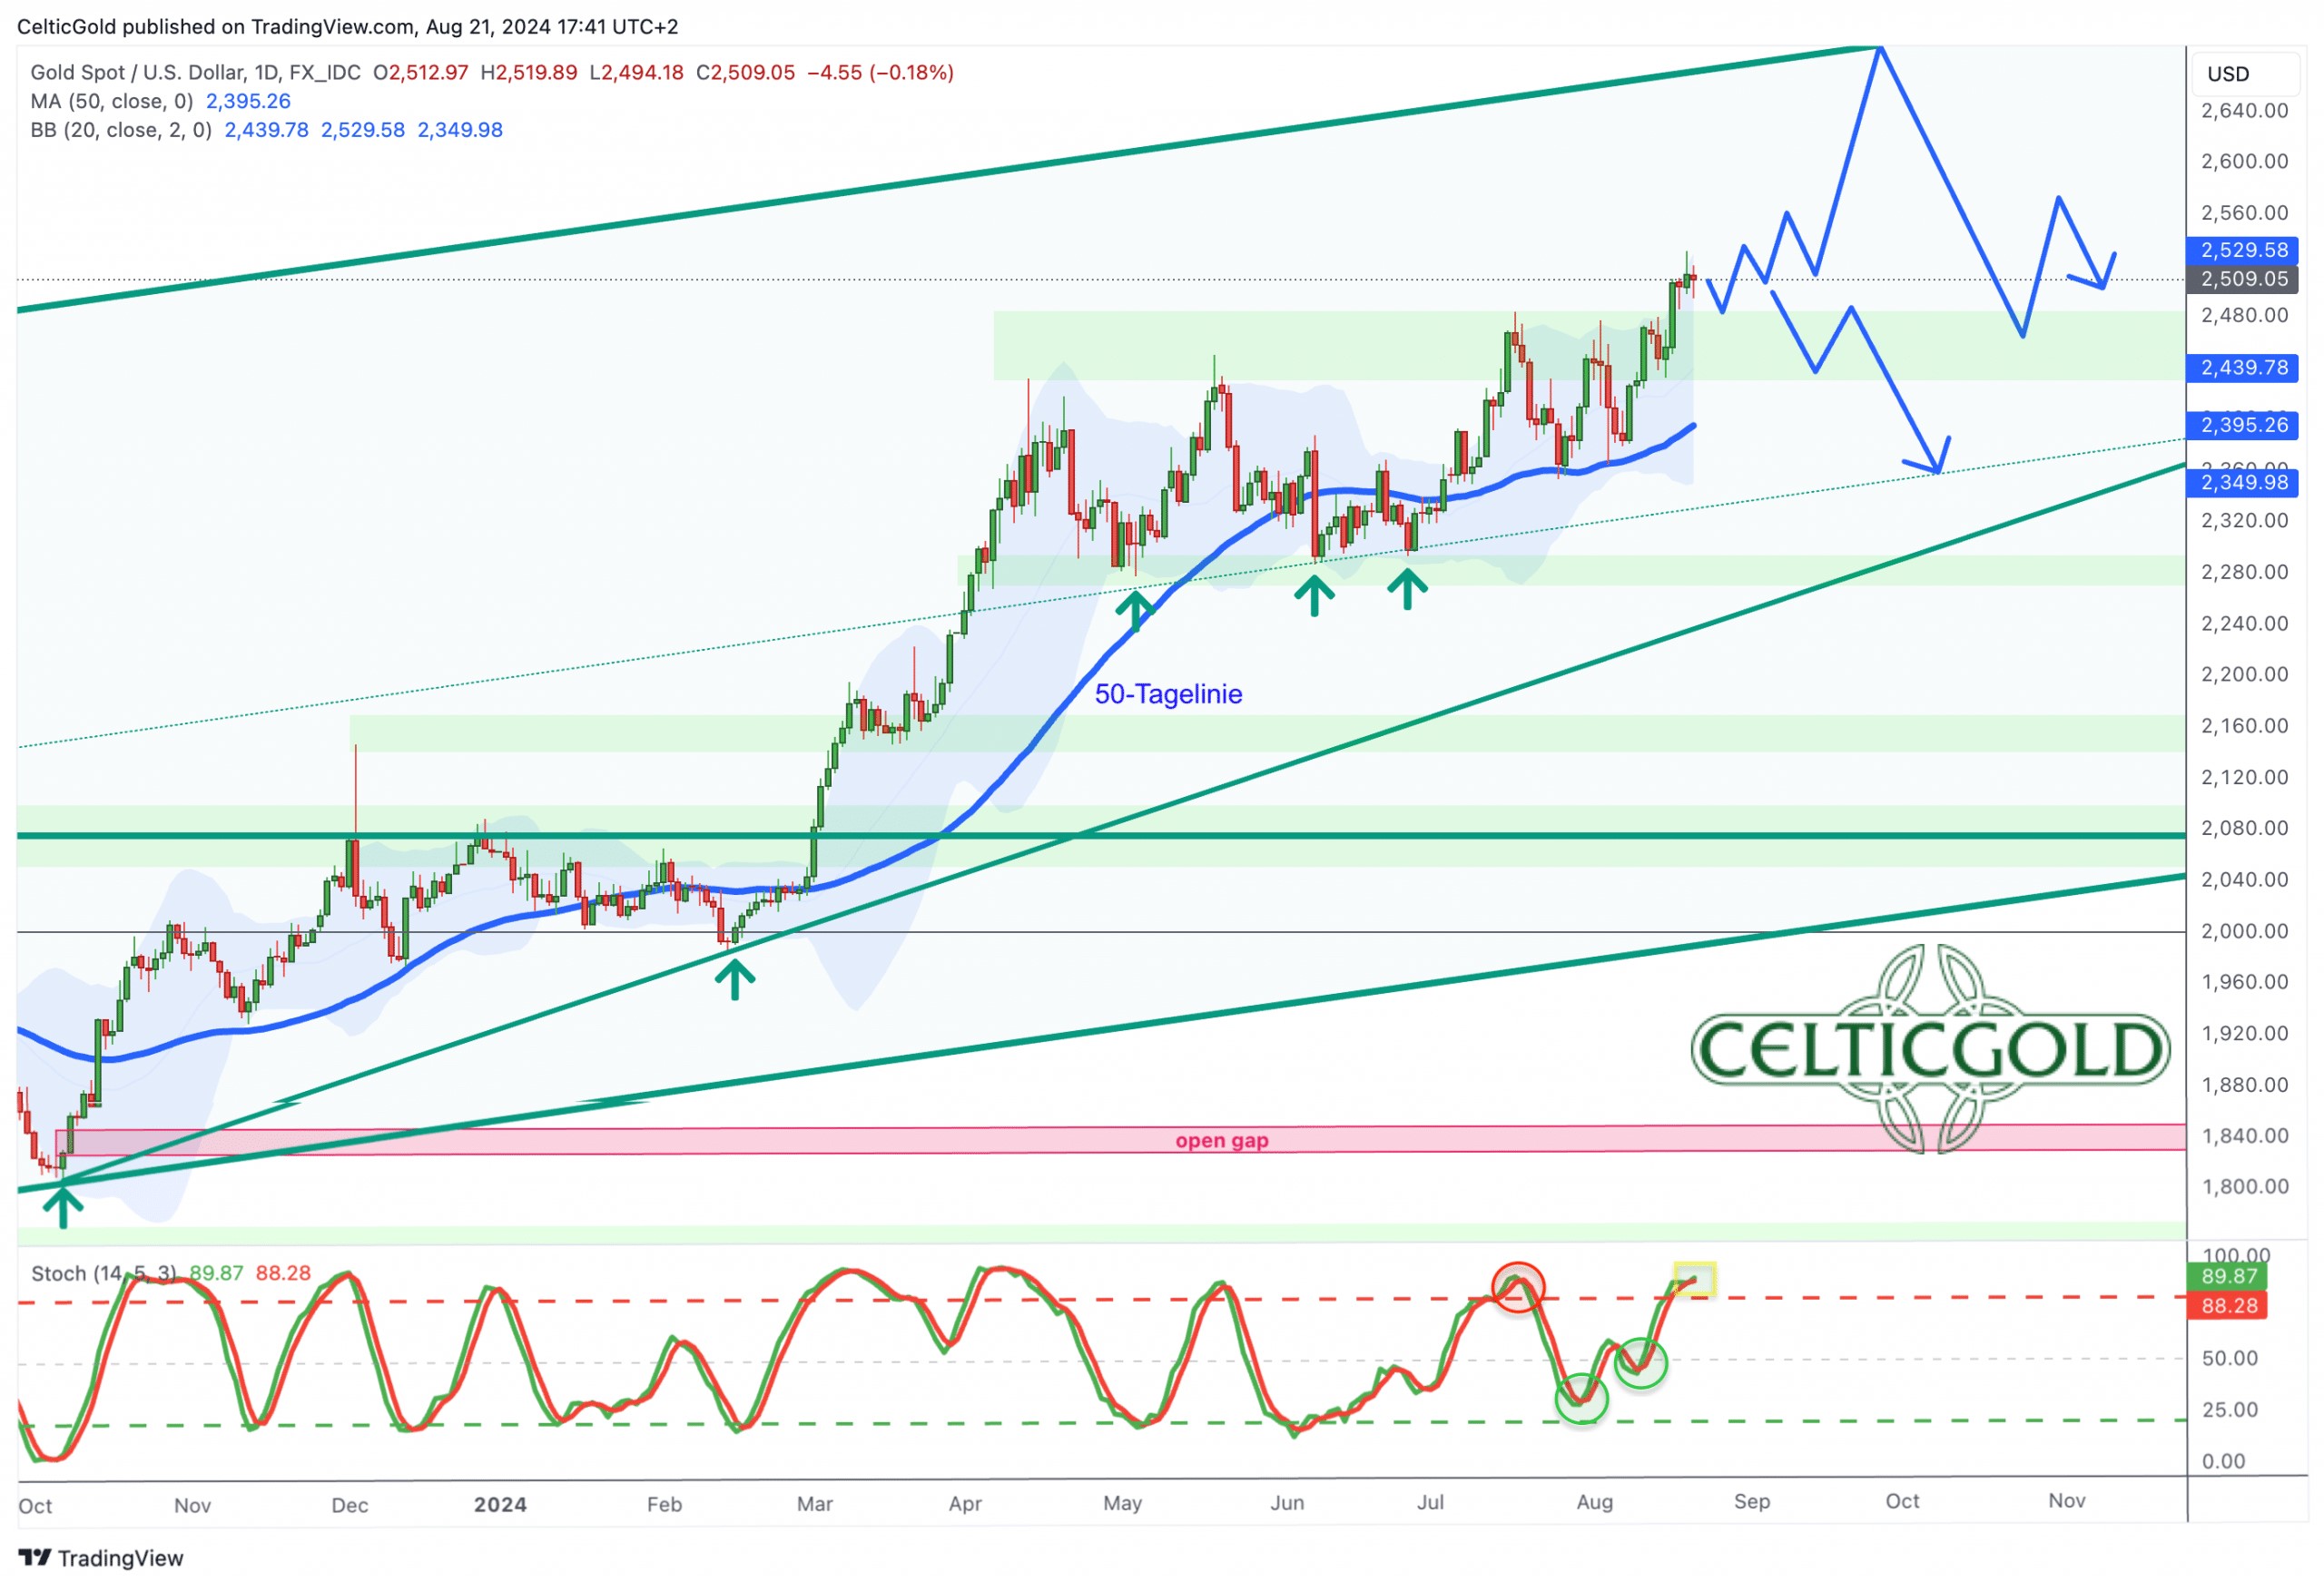
Gold in US-Dollar, daily chart as of August 23rd, 2024. Source: Tradingview
On the daily chart, the rising 50-day line (USD 2,395) has absorbed all correction attempts by the bears in recent months. Consequently, gold prices have broken out to new all-time highs after the four-month sideways consolidation. An end to the upward trend is not yet in sight.
However, since trading above USD 2,500 has only occurred for a few days, there is a lack of established technical levels. Therefore, the bulls currently face only the upper Bollinger Band (USD 2,529) on the daily chart. On the downside, the zone around the mid-July high of USD 2,484 provides initial support. Below that, there are two more highs from recent months at USD 2,450 and USD 2,430, so the entire area between USD 2,430 and USD 2,485 should initially absorb any potential pullback in the gold market.
In summary, the daily chart is bullish. The stochastic oscillator is bullishly embedded with both signal lines above 80, thus locking in the uptrend for the time being. The next price targets are at USD 2,535, USD 2,550, and USD 2,560. A conceivable exaggeration could temporarily push gold towards USD 2,700.
Commitments of Traders for Gold – Bearish
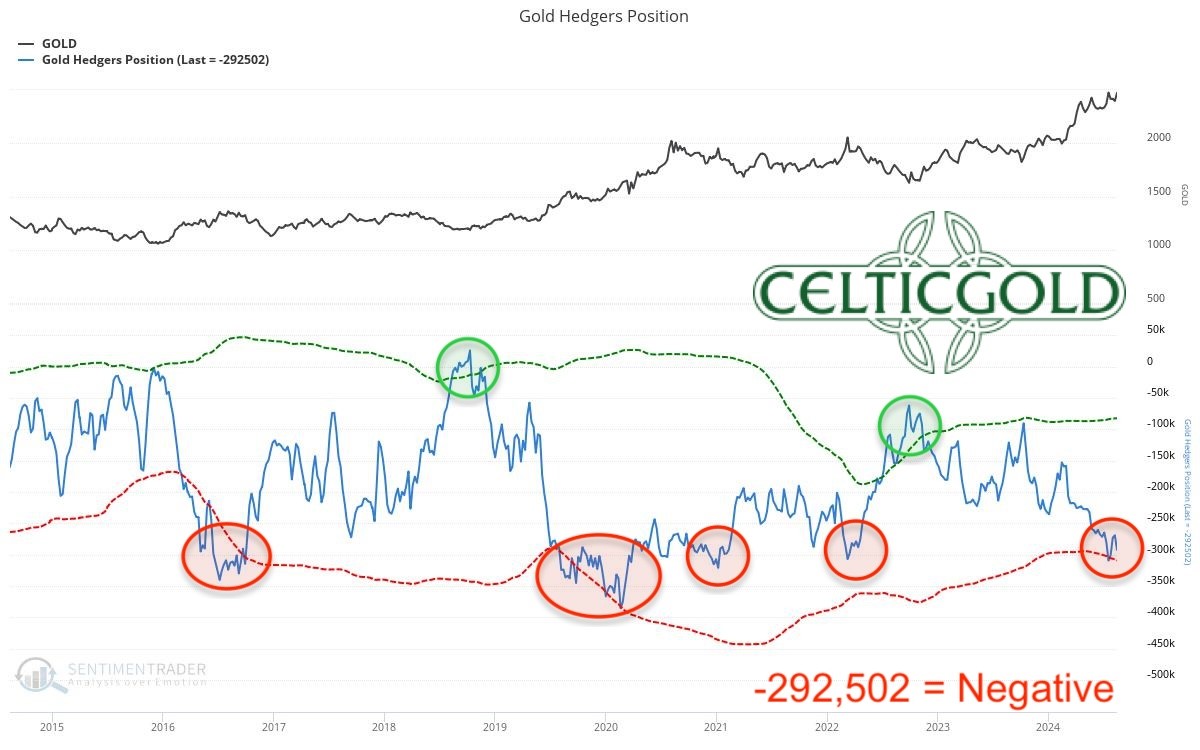
Commitments of Traders (COT) for gold as of August 13th, 2024. Source: Sentimentrader
At the closing price of USD 2,465, commercial traders held a cumulative short position of 292,502 gold futures contracts as of Tuesday, August 13th. Despite the two deep pullbacks to USD 2,352 on July 25 and USD 2,364 on August 5th, the cumulative short position has hardly changed compared to July 16th. At that time, commercial traders held 309,304 short gold futures contracts at a closing price of USD 2,469. Now, at roughly the same prices, there are about 17,000 fewer contracts.
Either way, the current positioning of professional actors in the paper gold market remains extremely unhealthy, as the professionals evidently see a high need for hedging. Moreover, since the last data collection, gold prices have risen significantly, hence the situation is likely to have further intensified.
Overall, the current CoT report remains very negative and clearly bearish. It would require significantly lower gold prices before this analytical component could be interpreted as neutral or even counter-cyclically bullish.
Sentiment for Gold – Too optimistic
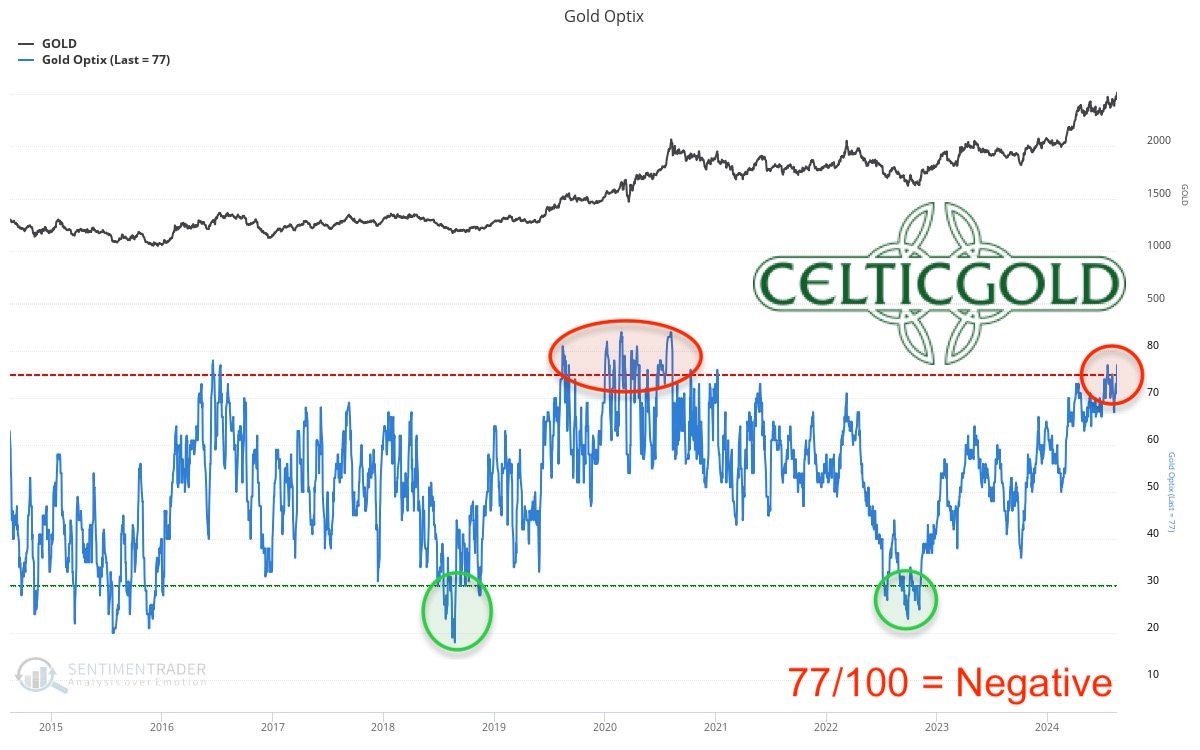
Sentiment Optix for gold as of August 19th, 2024. Source: Sentimentrader
The sentiment in the gold market is once again in the upper quarter of the sentiment scale, scoring 77 out of 100 points. Although rising gold prices have so far received little attention in the mainstream, the quantitative Optix analysis still measures an exaggerated level of expectation. However, there is still room move higher, hence the number of optimists could significantly increase with further rising gold prices.
Overall, the optimists continue to control the gold market, as gold prices have been rising for about two years. Since the previous increase has been rather slow and gradual, with interim consolidations primarily absorbed over time, a spectacular finale with a vertical price surge is still pending. Only then is the mainstream likely to jump on the gold bandwagon with enthusiasm.
Seasonality for Gold – Positive until end of August
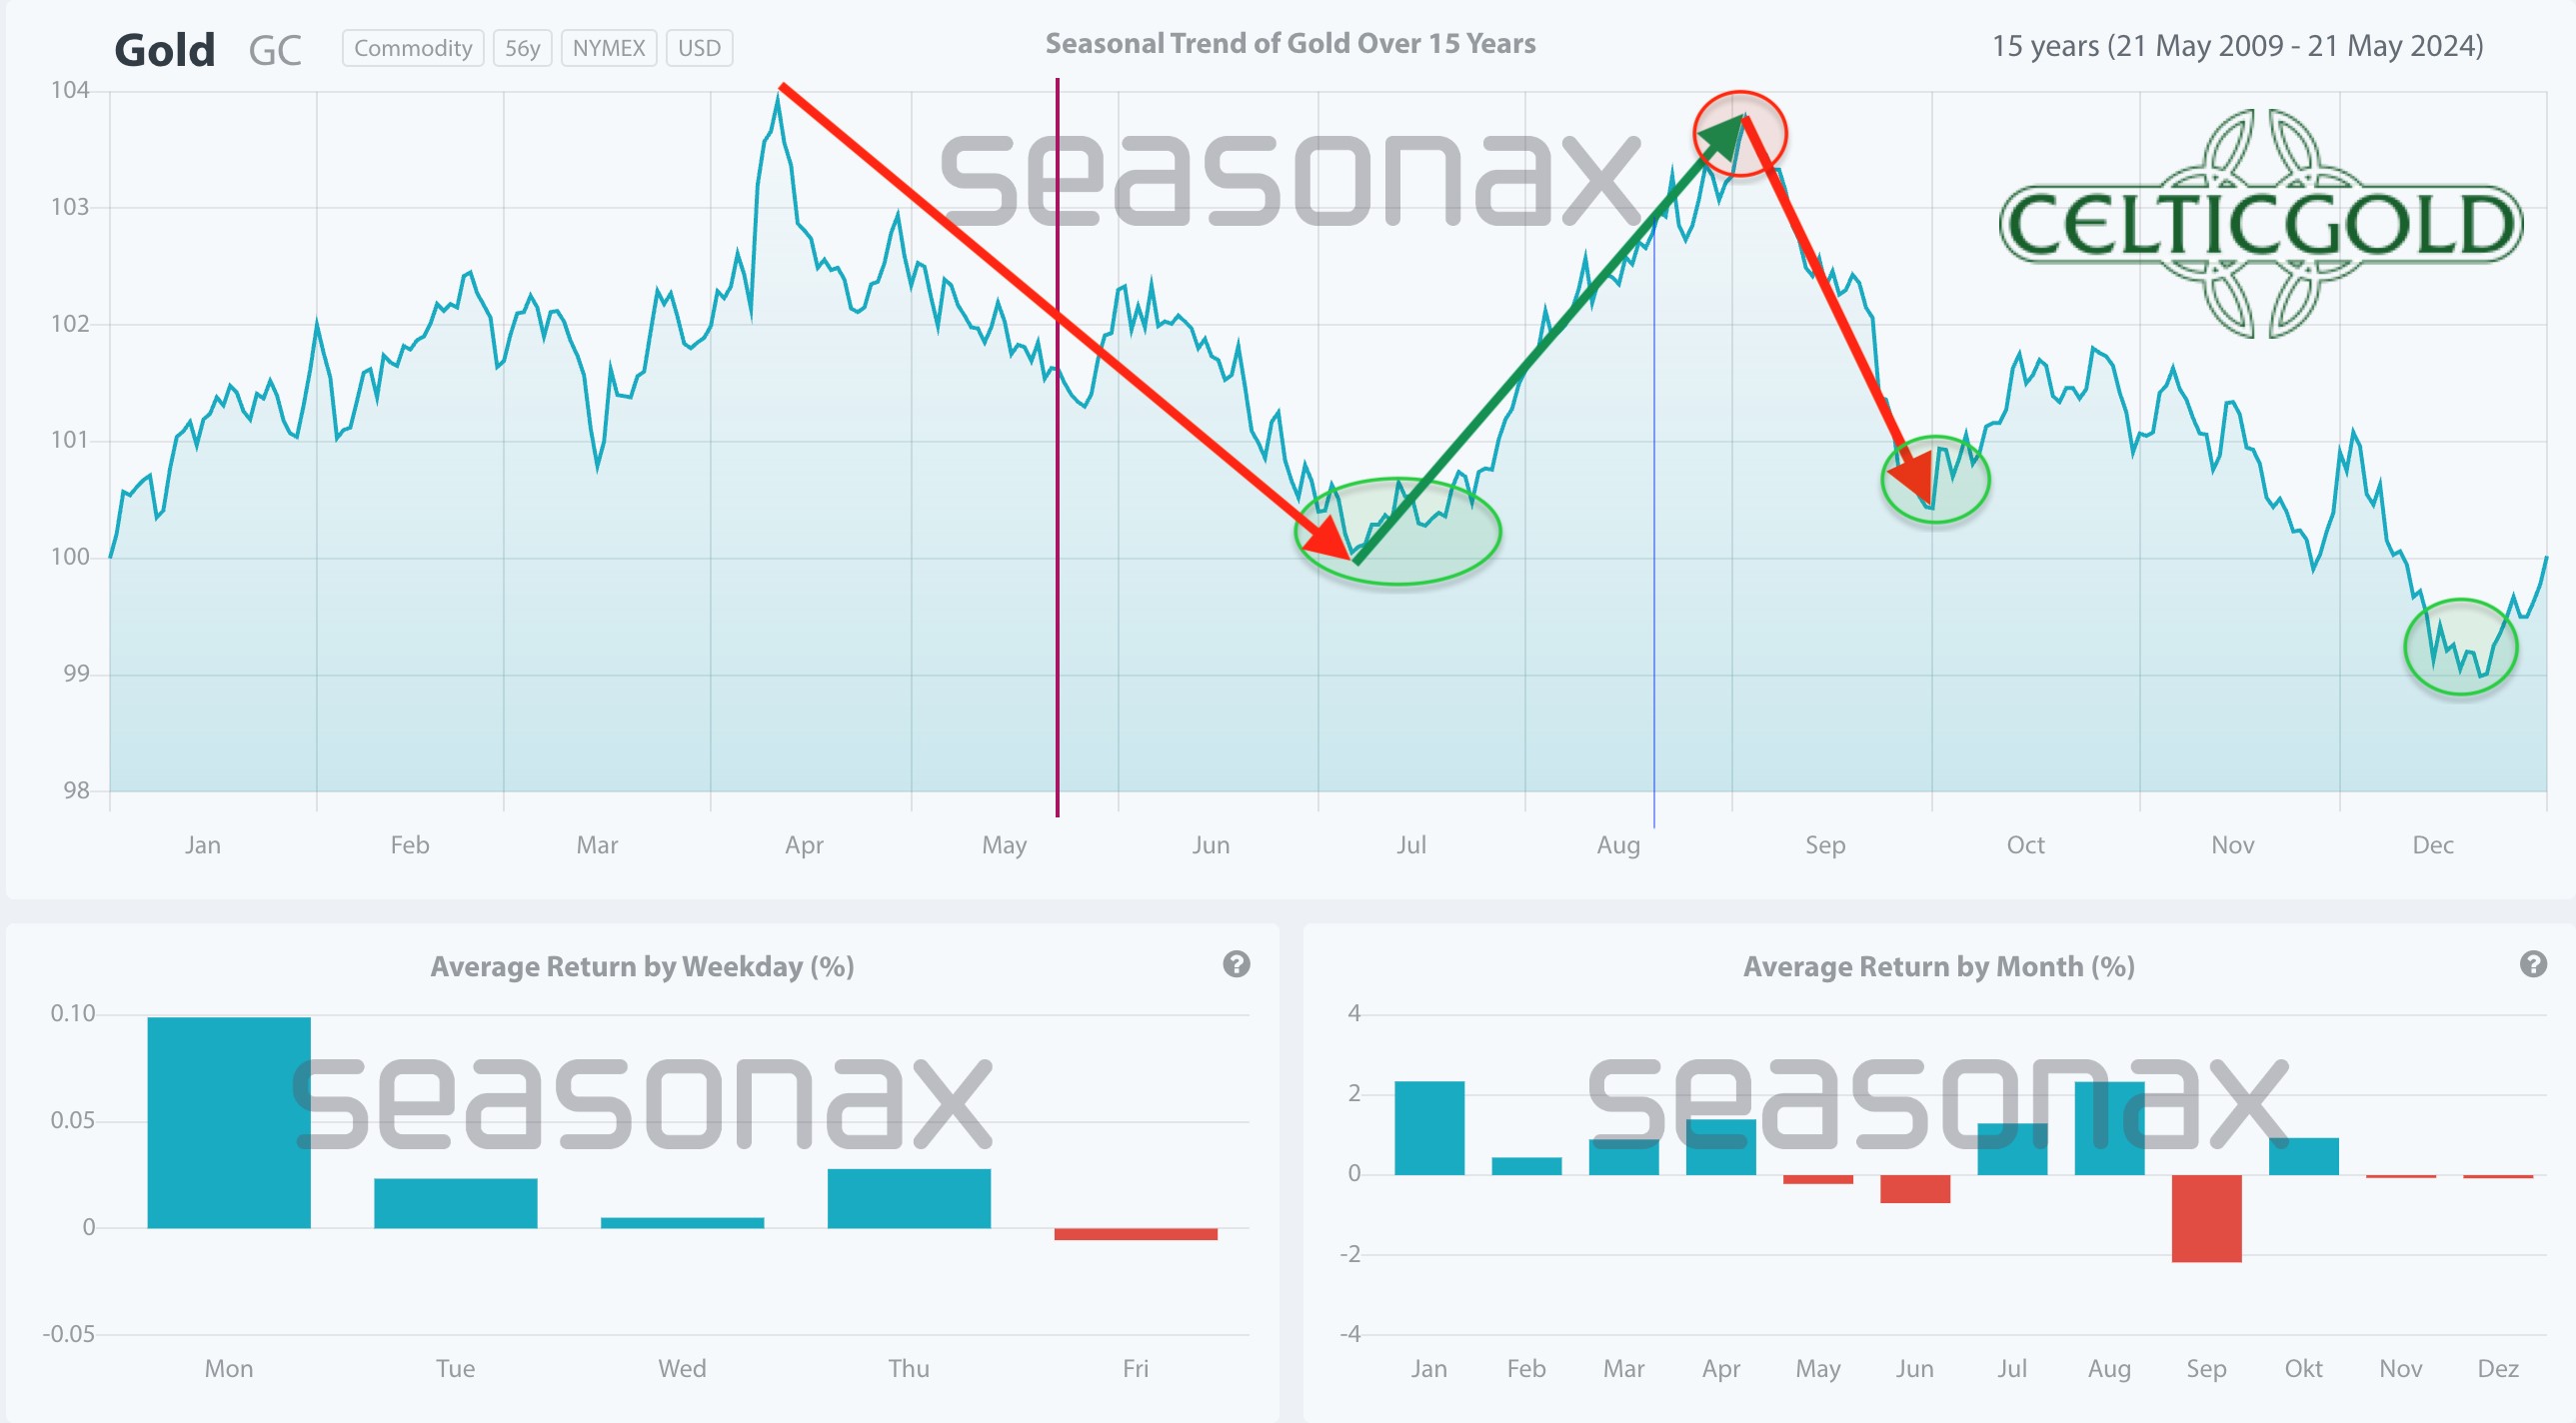
Seasonality for gold over the last 15-years as of August 21st, 2024. Source: Seasonax
From a seasonal perspective, the gold price is currently in the midst of its summer rally, which could continue for another one to two weeks. However, a dark red month of September awaits, during which the gold price has mostly taken a significant hit over the past 15 years. The next sensible and favorable buying opportunity might not arise until the end of September or early October, or even mid-December.
Overall, the seasonal component remains favorable until the end of August and then turns directly to dark red starting in early September.
Macro update – Gold mining stocks with significant catch-up potential
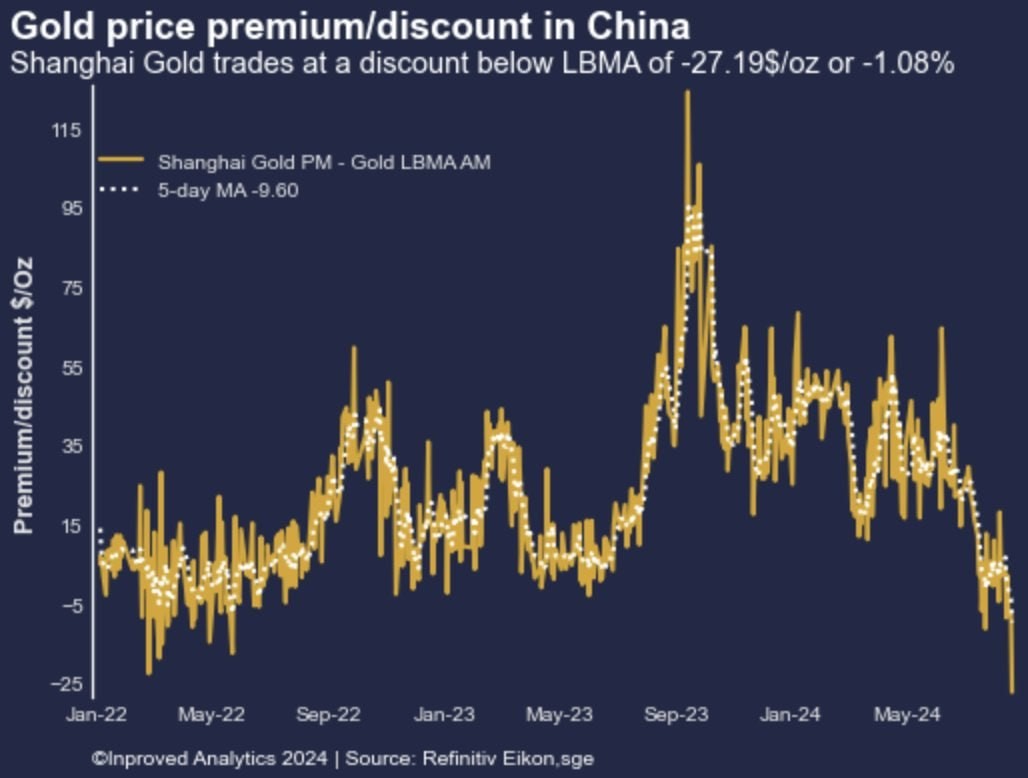
Gold price premium/discount in China as of August 21st, 2024. Source: InProved Analytics
While the rise in gold prices in the Western mainstream continues to receive little attention, the People’s Bank of China (PBOC) recently granted new gold import quotas to several Chinese banks. This measure followed an official two-month pause, mainly due to a slowdown in physical demand. Although the new quotas were issued in anticipation of revived demand, gold premiums on the Shanghai Gold Exchange continue to fall and have not yet seen a trend reversal despite the new all-time high in the gold price.
Chinese gold premiums at lowest level since early 2020
On Wednesday, Chinese gold premiums have reached their lowest level since early 2020 and are trading at a discount of USD 27.2 or 1.08% below the LBMA benchmark! The strong rise in gold prices in the West continues to hinder physical demand in China. As long as the local premium compared to the offshore market remains low or negative, the new quotas may only be utilized once market conditions improve.
While demand for jewelry remains weak, investment demand for gold remains fundamentally robust. However, the PBOC has not yet commented on these developments. The recent rise to over USD 2,500 impressively underscores the growing global interest in gold as a valuable investment asset.
In addition to the mentioned geopolitical hotspots in the Middle East and Ukraine/Russia, the rise in gold prices can also be attributed to increasingly weak economic data from the USA and possible interest rate cuts in the fourth quarter.
Longterm, gold outperforms all Fiat currencies
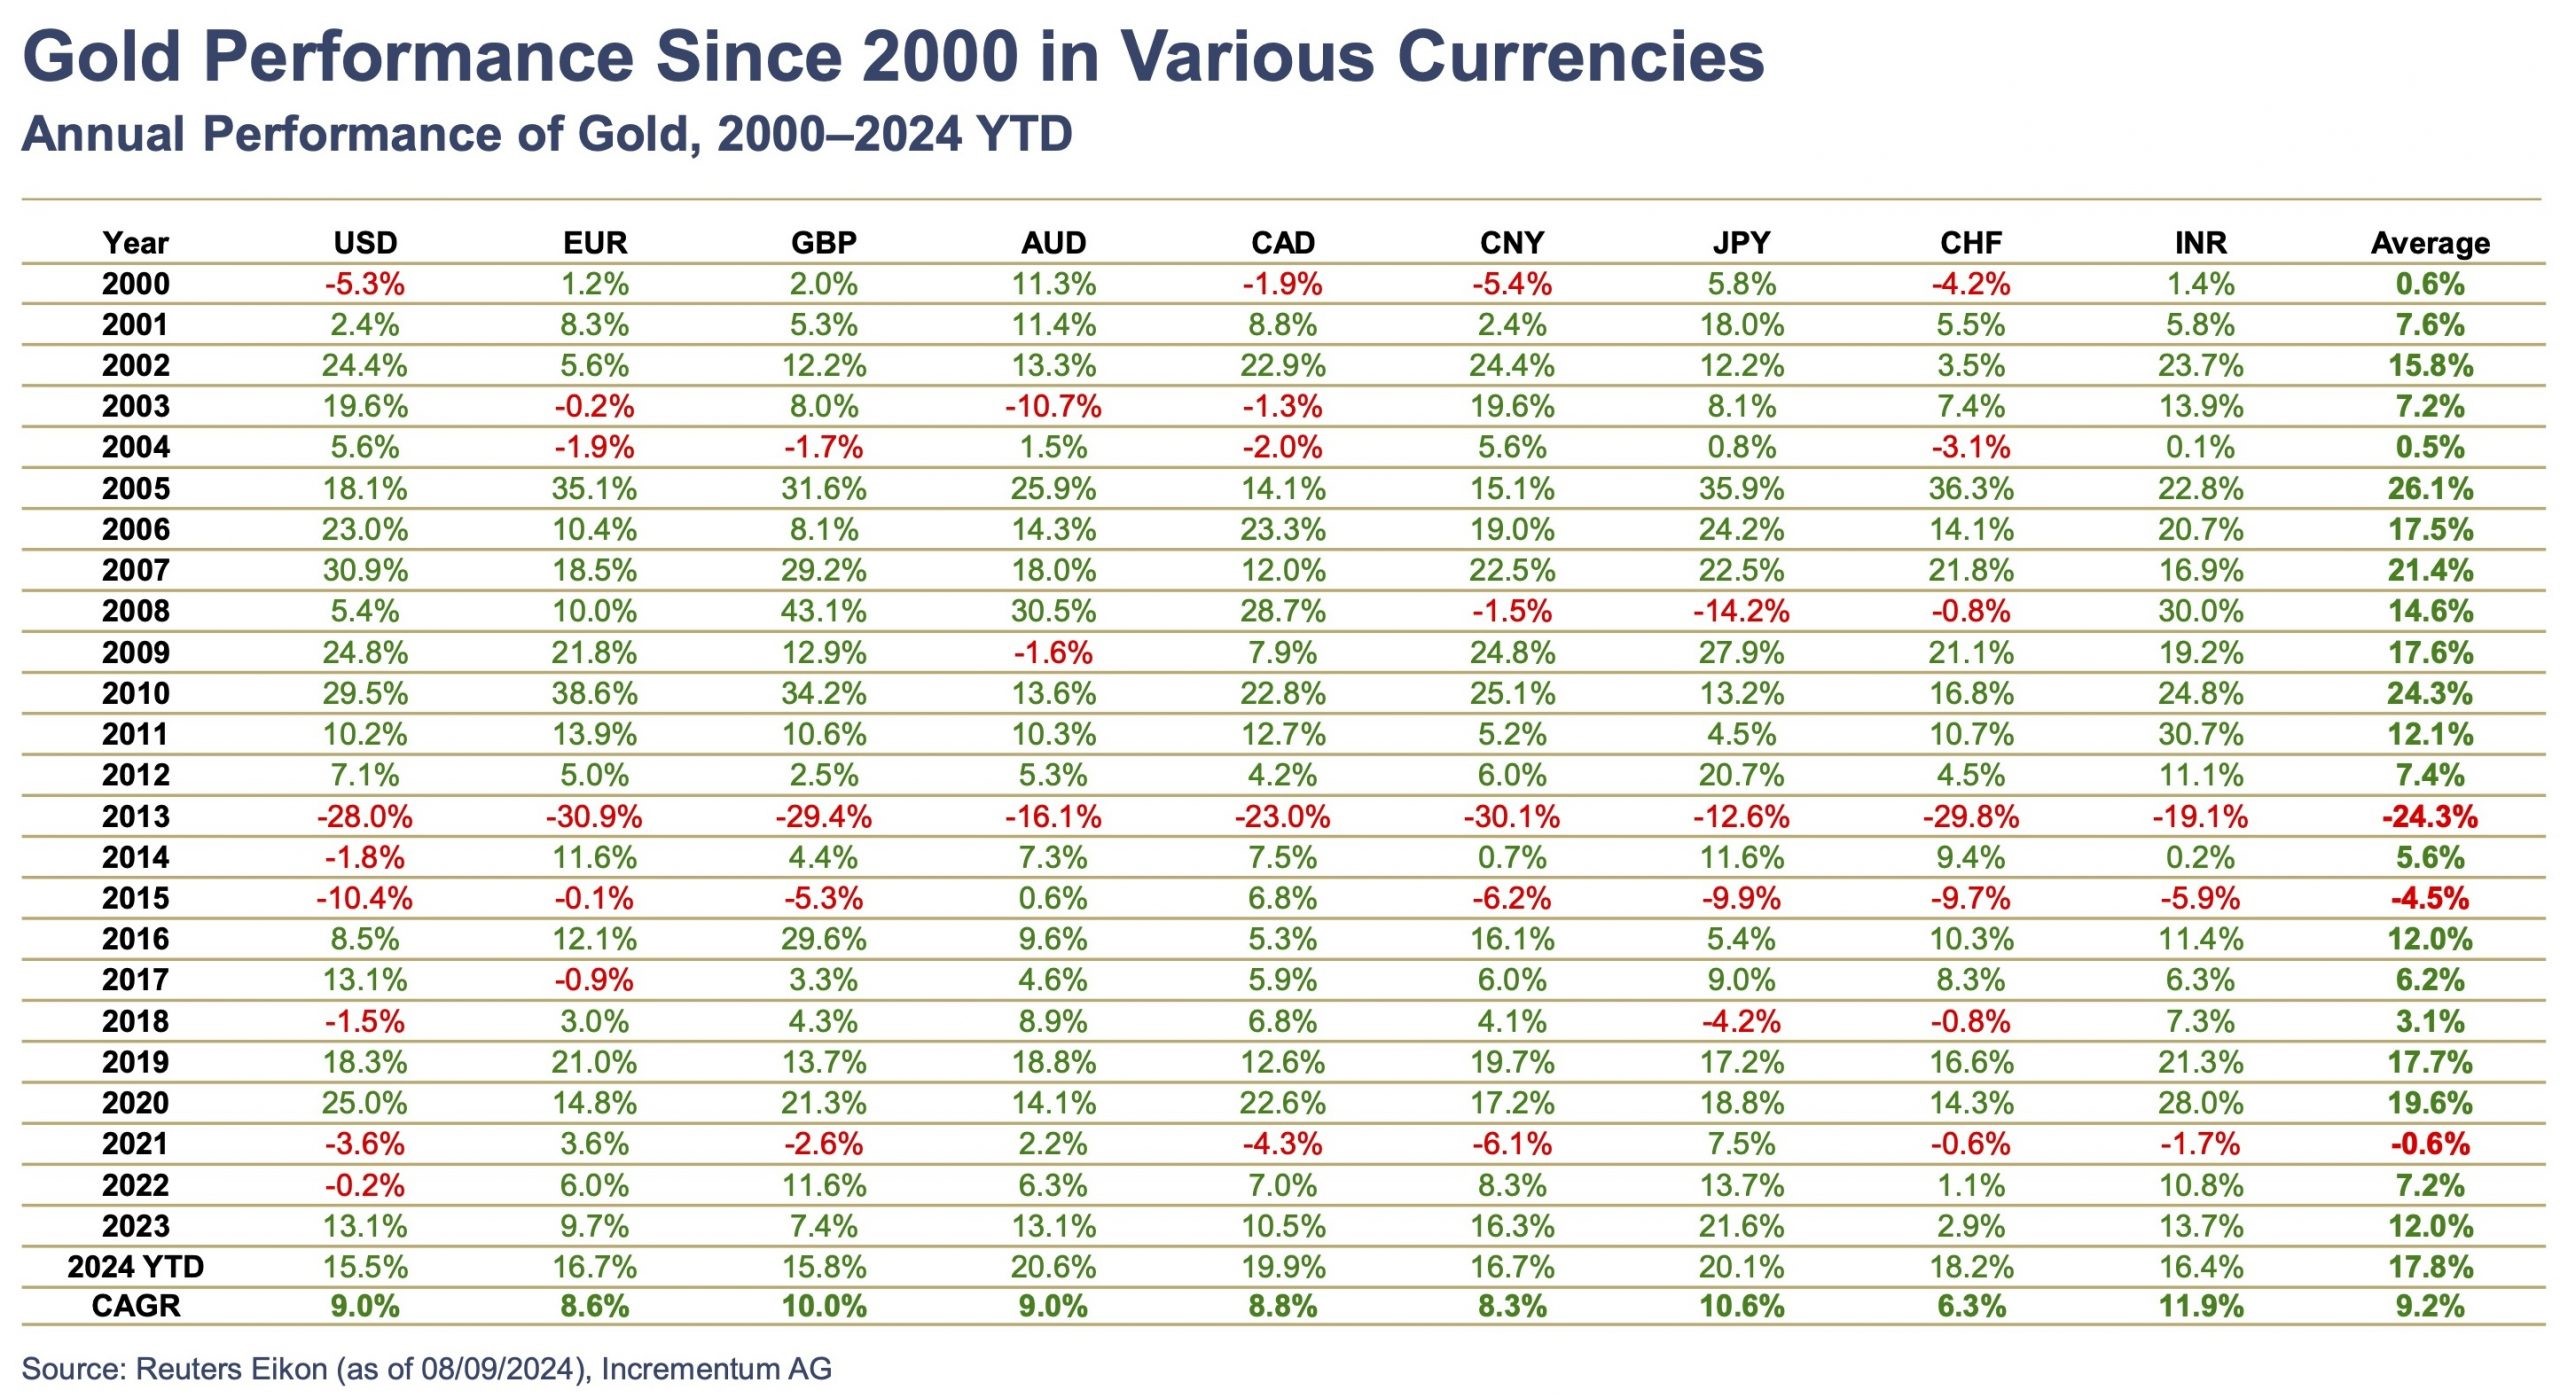
Gold performance since 2000 in various currencies, as of August 10th, 2024. Source: Incrementum AG
Additionally, persistent inflationary pressures and concerns about the ongoing devaluation of fiat currencies against gold are contributing factors. Gold has shown impressive performance compared to all fiat currencies over the past decades. For example, against the euro, gold has increased by an average of 8.6% annually over the past 20 years, while European government bonds and euro cash have yielded meager returns of 2.73% and 1.08%, respectively.
Long-term, gold has confirmed its role as a store of value and inflation hedge for millennia, as it retains its value in contrast to fiat currencies, which constantly lose purchasing power. An analysis over more than half a century shows that the US Dollar has lost 98.27% of its purchasing power, while the euro today retains only 1.7% of its original purchasing power!
Gold remains one of the best hedges against inflation and lols of purchasing power
Gold, on the other hand, has established itself as a benchmark for inflation, as it largely maintains its purchasing power over the years. This contrasts with the depreciation of fiat currencies, which is evident through rising gold prices. Despite short-term fluctuations, gold remains a reliable indicator of long-term monetary depreciation. The constant value of the precious metal makes it a preferred investment in times of economic uncertainty and political crises, as it does not depend on the credibility of an issuer (e.g., central bank) like fiat currencies do.
With the strong increase from USD 1,615 to USD 2,531, the precious metals sector has experienced a significant revival over the past two years after a prolonged stagnation. More and more central banks and investors worldwide are increasing their allocations in physical gold.
Gold mining stocks with significant catch-up potential
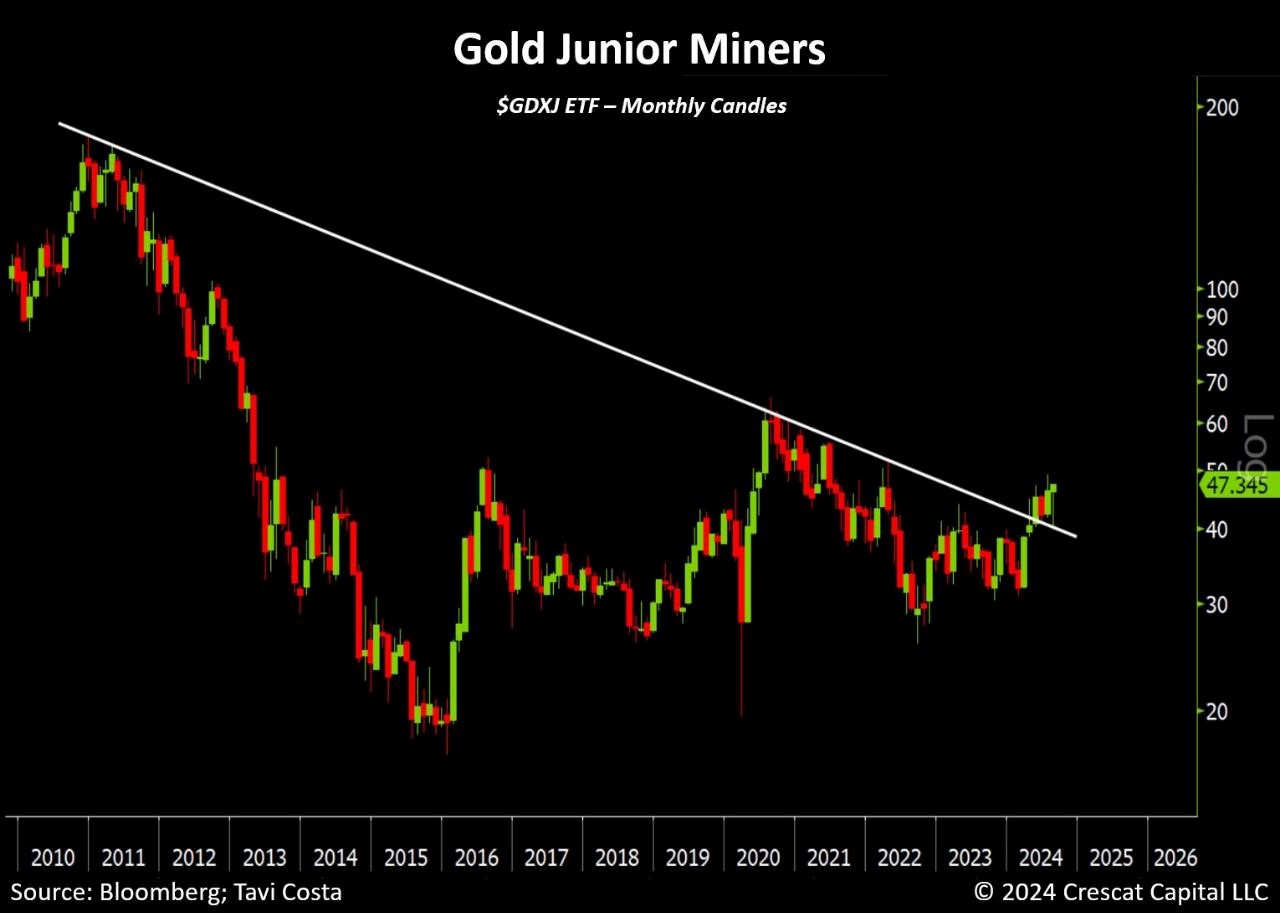
Gold Junior Miners GDXJ, as of August 19th, 2024. Source: Crescat Capital, Tavi Costa
However, while gold prices are soaring from one record high to the next, most gold mining stocks are still far from their all-time highs. The HUI Index (NYSE Arca Gold BUGS Index) would need to more than double to reach a new record high.
Only top companies like Agnico Eagle, with producing mines in Canada, Finland, Mexico, the USA, and Sweden, as well as Alamos Gold, with mines in Canada and Mexico, have managed to outperform the weak sector performance and surpass the gold price increase significantly. With the breakout over the important downtrend line of the past 14 years, the strongly lagging junior gold mining stocks (GDXJ) may now indicate a breakthrough.
Gold Fields strengthens its reserves with the acquisition of Osisko Mining
The slowly improving situation is confirmed by merger and acquisition activities. The latest example is the acquisition of Osisko Mining by Gold Fields. Accordingly, Gold Fields, the world’s seventh-largest gold producer based in Johannesburg, South Africa, plans to acquire Osisko Mining for approximately CAD 2.16 billion. Gold Fields offers Osisko shareholders CAD 4.90 per Osisko share, representing a premium of about 55% compared to the last price before the acquisition announcement!
The transaction was formalized through a definitive agreement on August 12th, 2024, and is expected to be completed in the fourth quarter of 2024, subject to the fulfillment of all conditions. After the acquisition, the shares of the Canadian mineral exploration company Osisko Mining are expected to no longer be traded on the Toronto Stock Exchange (TSX).
Gold Fields, already involved as a joint venture partner in Osisko’s high-grade Windfall gold deposit in Québec, sees the acquisition as a strategic addition to its portfolio and an opportunity to expand production in the region. Given the fierce competition among major gold producers, this acquisition will strengthen Gold Fields’ reserves and simultaneously generate further interest in the gold mining sector. Additionally, the acquisition highlights the extremely low valuations of most gold mines and mine developers.
Conclusion: Gold – The rally is likely to continue
The rally in the gold market has been ongoing for almost 11 months without any significant pullbacks. Although there have been two interim sideways consolidations, a genuine market correction with a price drop of over 10% has not been observed.
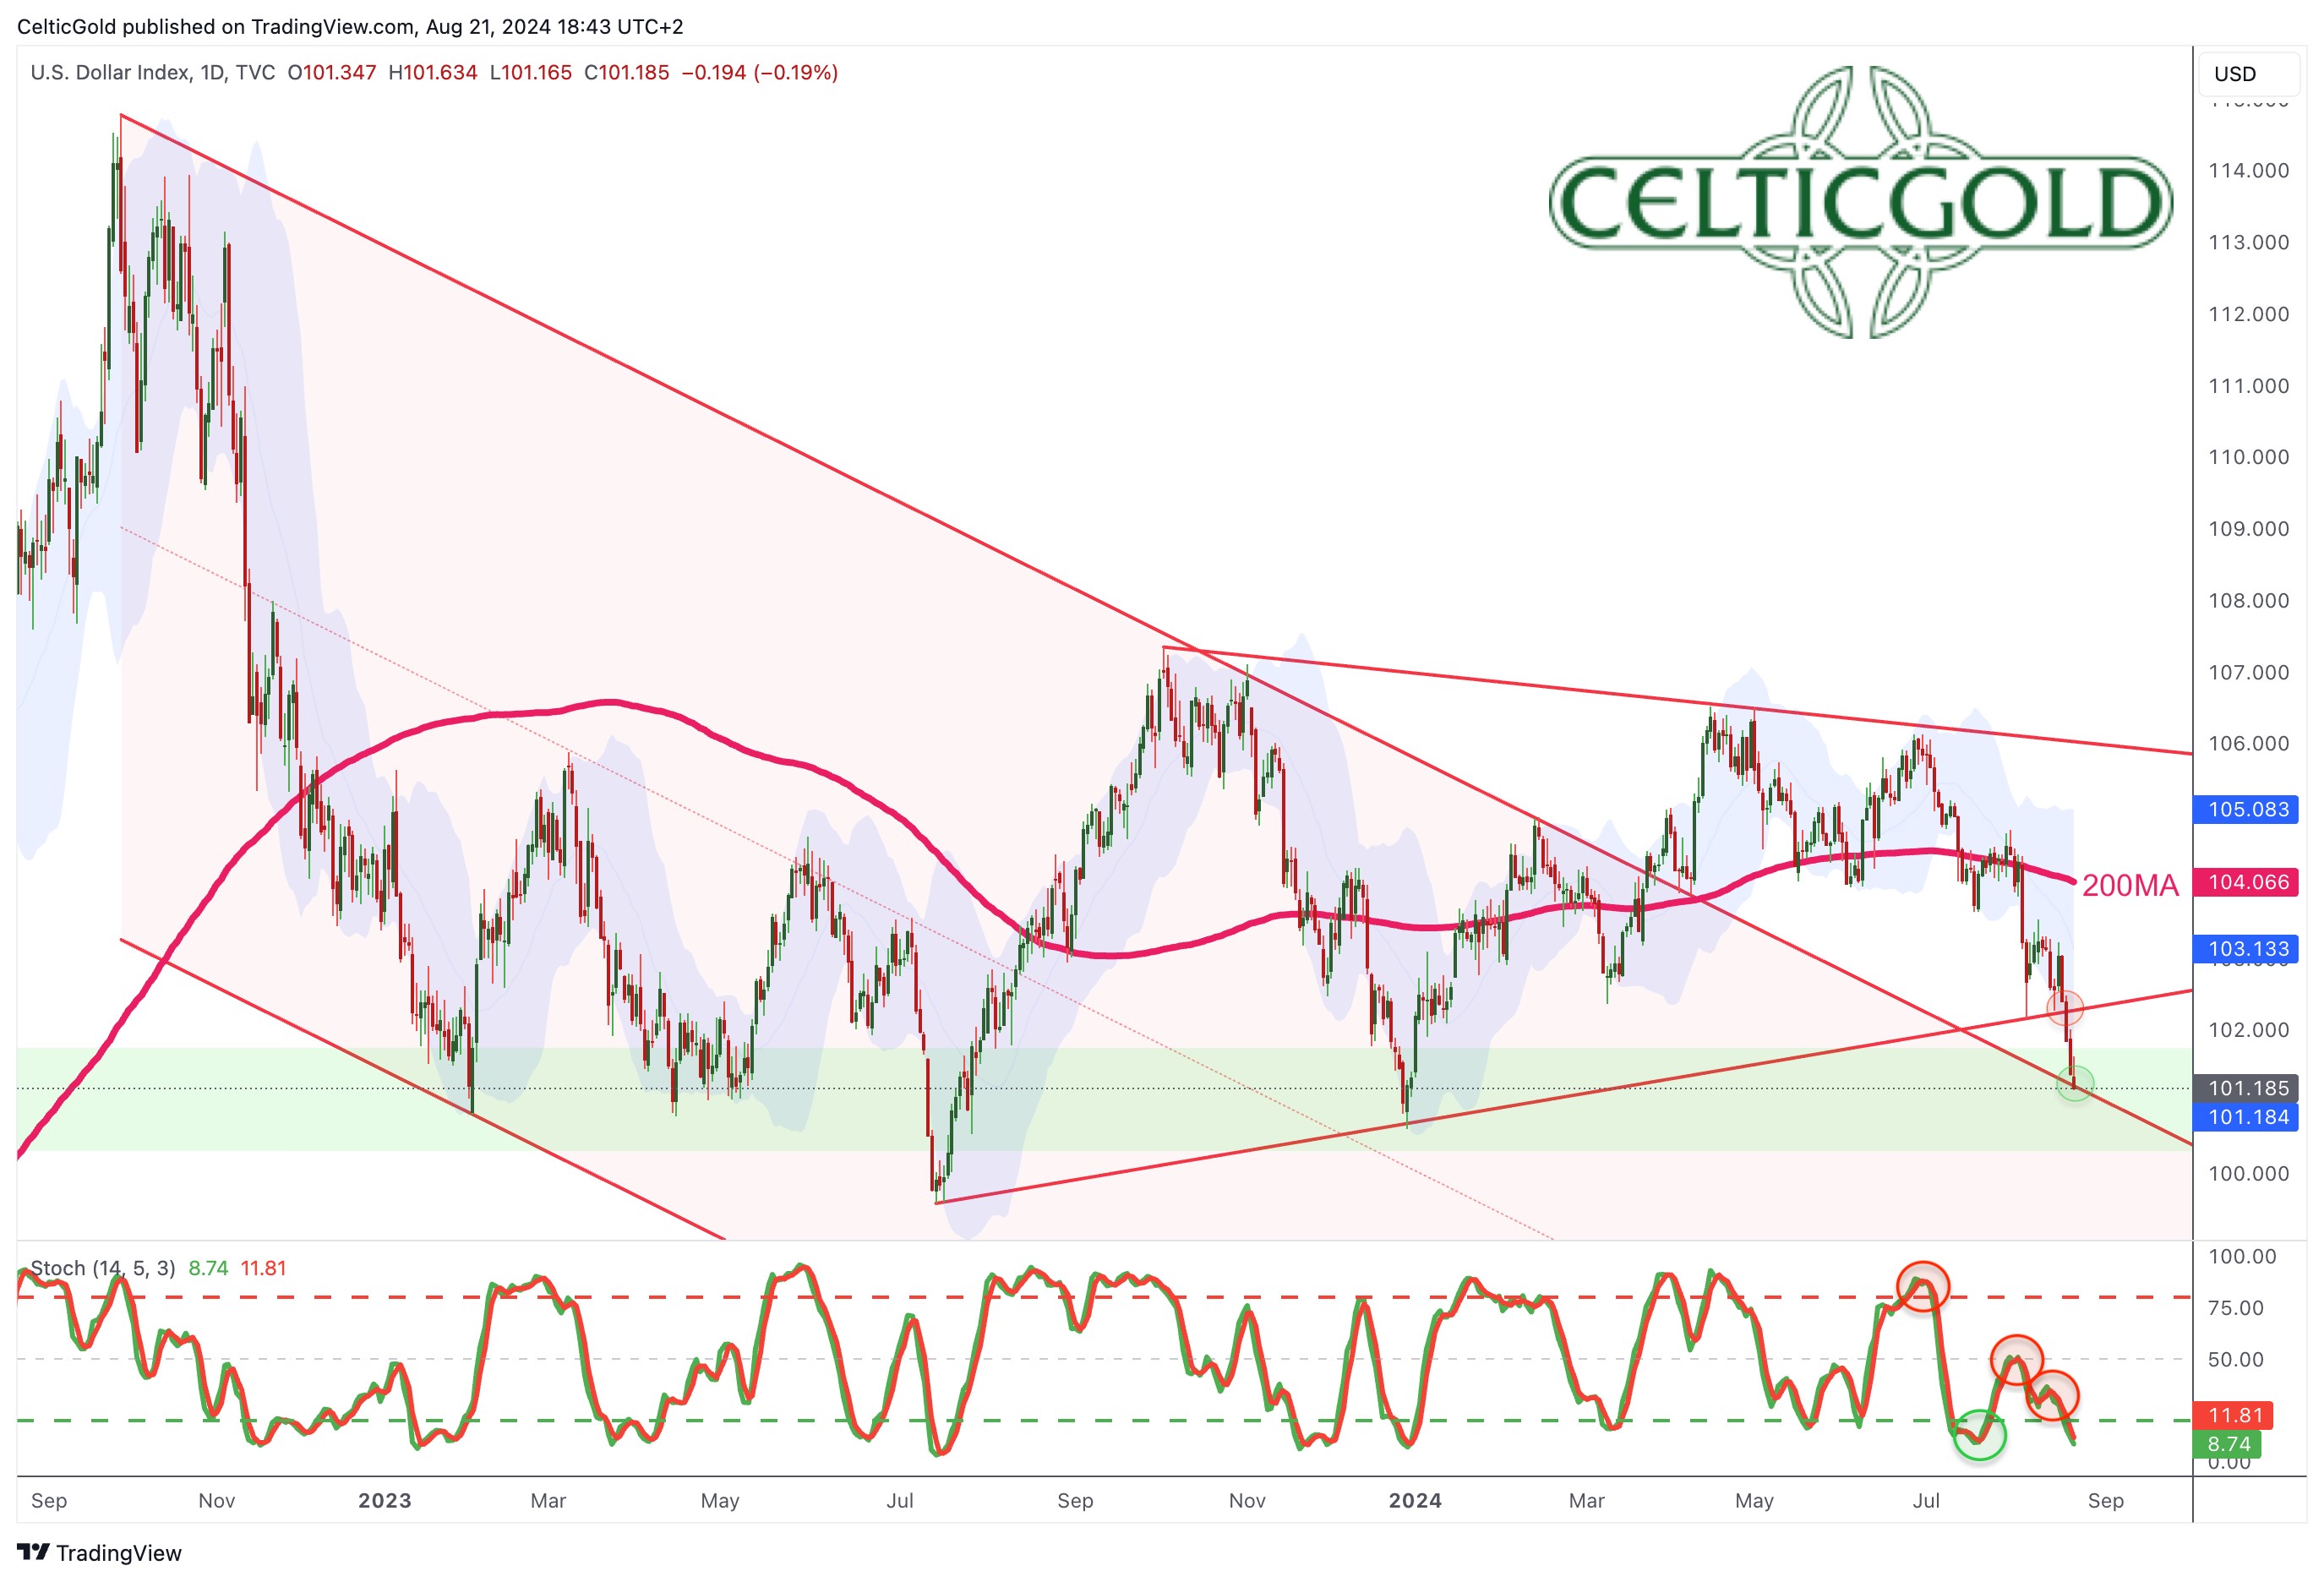
US-Dollar Index DXY, daily chart as of August 21st, 2024. Source: Tradingview
Despite the positive price development and strong supportive macro and fundamental conditions, the gold market is not without challenges. After a gain of nearly 40% since October 2023, the gold price is overbought. At the same time, the US dollar is significantly oversold after the decline of the last four weeks and has entered a broad support zone. Additionally, the Commitment of Traders (CoT) data is now very negative, while sentiment shows unhealthily high levels of optimism.
So far, gold has consistently been able to recover from any pullbacks in recent months and then continue to rise. The market dynamics reignited by the breakout above USD 2,500 suggest that the sideways movement prevailing since mid-April has ended and a sharp price increase may now be imminent.
Nevertheless, for September, a strong correction in the stock market and a recovery in the US dollar could temporarily negatively affect gold prices. However, we suspect that the zone between USD 2,430 and USD 2,485 should initially absorb any pullbacks. The “worst-case” on the downside is likely around USD 2,400. Despite short-term pullbacks, gold is expected to be on a broader path towards USD 2,700 to USD 3,000.
Gold – The rally is likely to continue as long as the daily stochastic remains embedded
In the short-term, we suggest keeping an eye on the stochastic oscillator on the daily chart. If both lines continue to stay above 80 by Friday evening, the super bullish embedded status remains in place and the path higher is very likely to continue next week and thereafter. If on the other side, the oscillator loses this favorable but rate setting, however, it might be very likely that gold has found a short-term top at USD 2,531
“August 23rd, 2024, Gold – The rally is likely to continue” – analysis was initially published on August 21st, 2024, by www.celticgold.de and translated into English as well as completely updated on August 23rd, 2024.
Feel free to join us in our free Telegram channel for daily real time data and a great community. If you like to get regular updates on our gold model, precious metals and cryptocurrencies you can subscribe to our free newsletter.
*******
 Florian Grummes (born 1975 in Munich) has been studying and trading the Gold market since 2003. In 2008 he started publishing a bi-weekly extensive gold analysis containing technical chart analysis as well as fundamental and sentiment analysis. Parallel to his trading business he is also a very creative & successful composer, songwriter and music producer. You can reach Florian at: [email protected].


