Meandering Metals
Several months ago I presented you with an “evil” plan with which the metals and miners have followed through quite well with regard to their downside movements. However, since that time, they have been acting more like kittens rather than evil patterns. They have been meandering in quite corrective looking fashion for quite some time now. But, I still believe we need to see much stronger bullish sentiment before we can begin our run to the lower lows for which we have been in search for quite some time now.
Yet, for now, there is nothing that is being presented to me at this time which suggests I should not be looking higher for another rally leg to take hold in the near term.
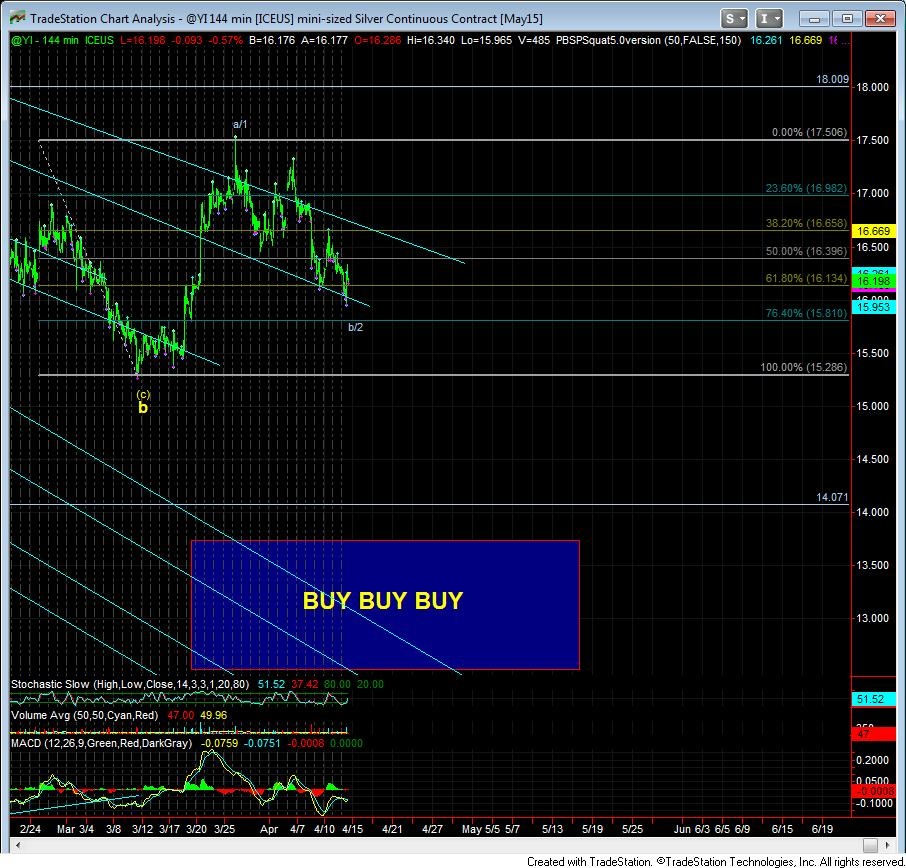
The main chart upon which I would like to focus is the daily silver chart. Take a look at the pullback we have seen thus far, which really does track quite nicely as a corrective pullback. While there is still potential for one more lower low in the micro count to be seen, it is not necessary, and we can consider the pattern as just about completed to the downside at this point in time.
Specifically, if you look at the daily silver chart Slow Stochastics, we are in the bottoming region. Normally, this would concern me as the stochastics traditionally imbed down here, but that is only in the heart of a 3rd wave down. And, due to the manner in which we have dropped from the highs, this does not look or act like a traditional 3rd wave down. Furthermore, the RSI is now moving into a bottoming region we have seen set up rallies in the past. So, ultimately, as long as we do not see a sustained break of 15.80 in the silver chart – which I have mentioned for the last several weeks - I will continue to look up for a rally to take hold.
As for GLD, the support levels I am now watching are the 113.35 and the 112 regions. And, in GDX, they are the 18.77 and 17.90 regions. Should we be able to take out the March highs in the GDX, it would suggest we are on in either wave 3 or c of the alt b higher. If you remember my plan from months ago, my intention would be to exit the market on the long side (from short term positions), and add to my long term hedges once this next rally leg completes its own 5 wave structure and completes its c-wave or 3rd wave. I will not be waiting around for wave 5 of (c) on the long side, unless the market clearly tells me I should. For now, I am sticking with the plan.
See Avi’s charts illustrating the wave counts on the metals below:
********
Avi Gilburt is a widely followed Elliott Wave technical analyst and author of ElliottWaveTrader.net (www.elliottwavetrader.net), a live Trading Room featuring his intraday market analysis (including emini S&P 500, metals, oil, USD & VXX), interactive member-analyst forum, and detailed library of Elliott Wave education.


 Avi Gilburt is a widely followed Elliott Wave technical analyst and author of


