The Step Sum’s 15-Count


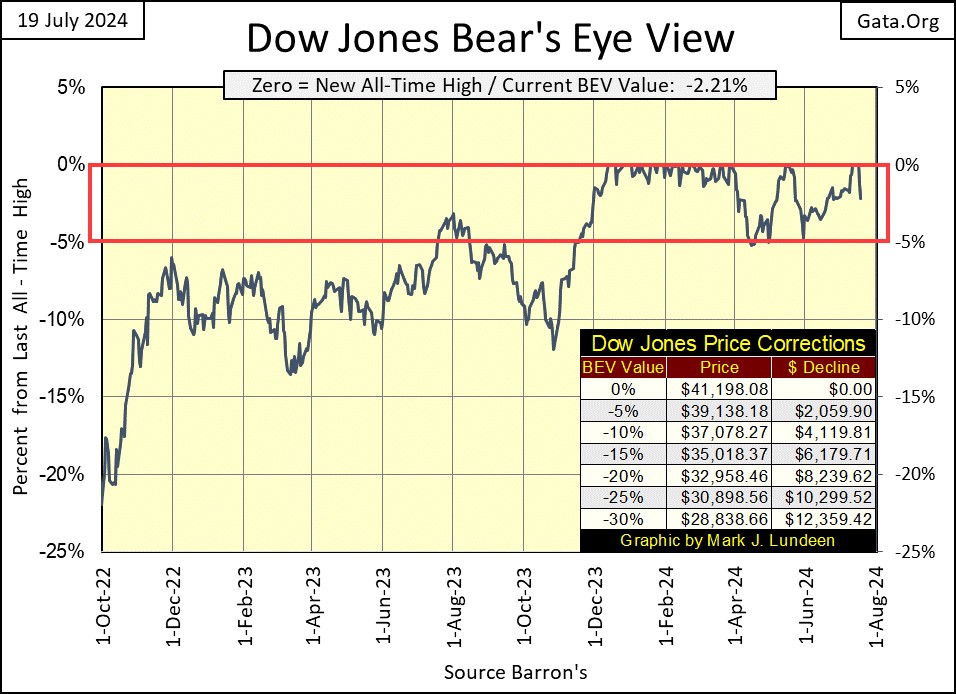
How did the Dow Jones do this week? Just looking at its BEV chart below, it closed 2.21% below its last all-time high. But this week the Dow Jones made three new all-time highs (BEV Zeros), #27-29 since it began its current advance last November, pushing the Dow Jones up 1,194 points by Wednesday’s close.
Such an impressive advance, is something a Bear’s Eye View chart can never properly display. It is what it is. This week’s last two trading days were not as kind to the bulls as they could have been, a loss of 910 points from the highs of Wednesday’s new all-time high close.
Though the Dow Jones dropped 910 points at week’s close, it still closed the week with a BEV of -2.21%, which is still well within scoring position. So, I’m remaining bullish on the stock market, it’s as simple as that. Why make it any harder than it has to be?
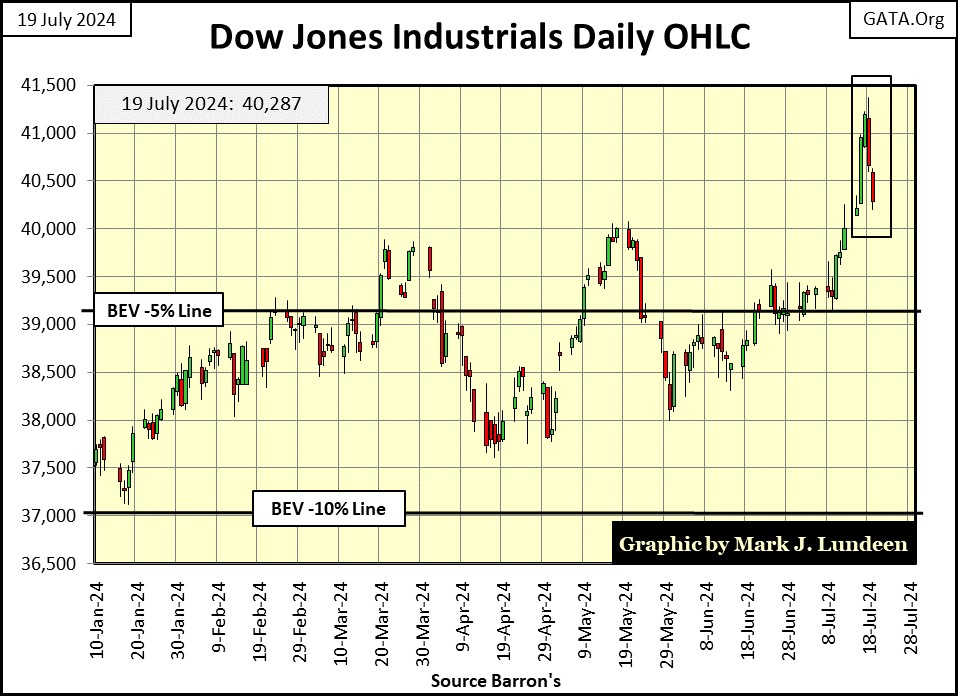
The chart below plotting the Dow Jones in its daily bars, is a superior view of this week’s exciting market action, than is the BEV chart above. Though the FOMC continues draining “liquidity” from the financial system, or so they claim to be doing, this week still saw impressive gains early on. So much so, I’m not surprised seeing a sharp correction on Thursday and Friday.
So, what to expect for the Dow Jones next week? I personally expect a continuation of the post Wednesday pullback seen below, but I don’t believe we’ve seen the last Dow Jones all-time of this advance. Why not? The first thing that would have to happen for me to even consider such a thing, would be for the Dow Jones to close below its BEV -5% line, and stay there in the chart below.
Note: this key BEV -5% line was raised this week’s by the three new all-time highs, from last week’s 38,000, to now 39,138. Also, last week’s get the hell out of Dodge City’s BEV -10% line was at 36,000. As seen in the table in the BEV chart above, the Dow Jones new BEV -10% line is now 37,078.
Moving on to my table listing BEV values for the major market indexes I follow, below, it’s obvious how bullish Tuesday was, with eleven new BEV Zeros, and indexes in scoring position going down to #16. By Friday, these indexes saw no new all-time highs, but everything down to #12 closed in scoring position (BEVs of -0.01% to -4.99%).
Keep in mind, most daily closes in any market’s bull-market advance, close in scoring position, * NOT * at a new all-time high. It’s not hard for a market index, a single stock, or an ounce of gold or silver closing in scoring position, to move up a few percentage points and close at a new all-time high. This is just how all market advances work, so I remain bullish on the stock market at this week’s close.
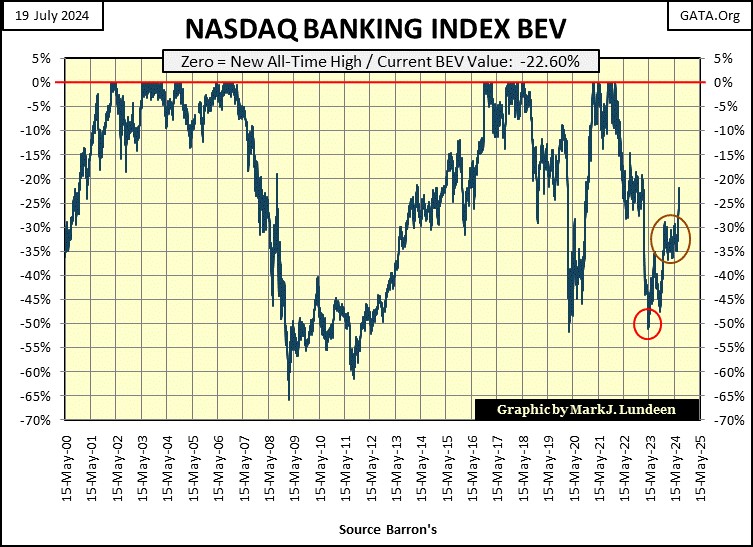
One thing I find very odd about this advance, is how the banking index (#20 in the table below) continues bouncing off its lows of May 2023. In May of 2023, big banks were closing their doors in Silicon Valley, due to their reserves being eroded away from rising bond yields. Since then, what has changed that would make these companies once again attractive to the investing public? Nothing that I can see. Still, their valuations continue rising, recovering over half of their 2023 losses at the close of this week. I don’t like the banks.
The table below was commented on above.
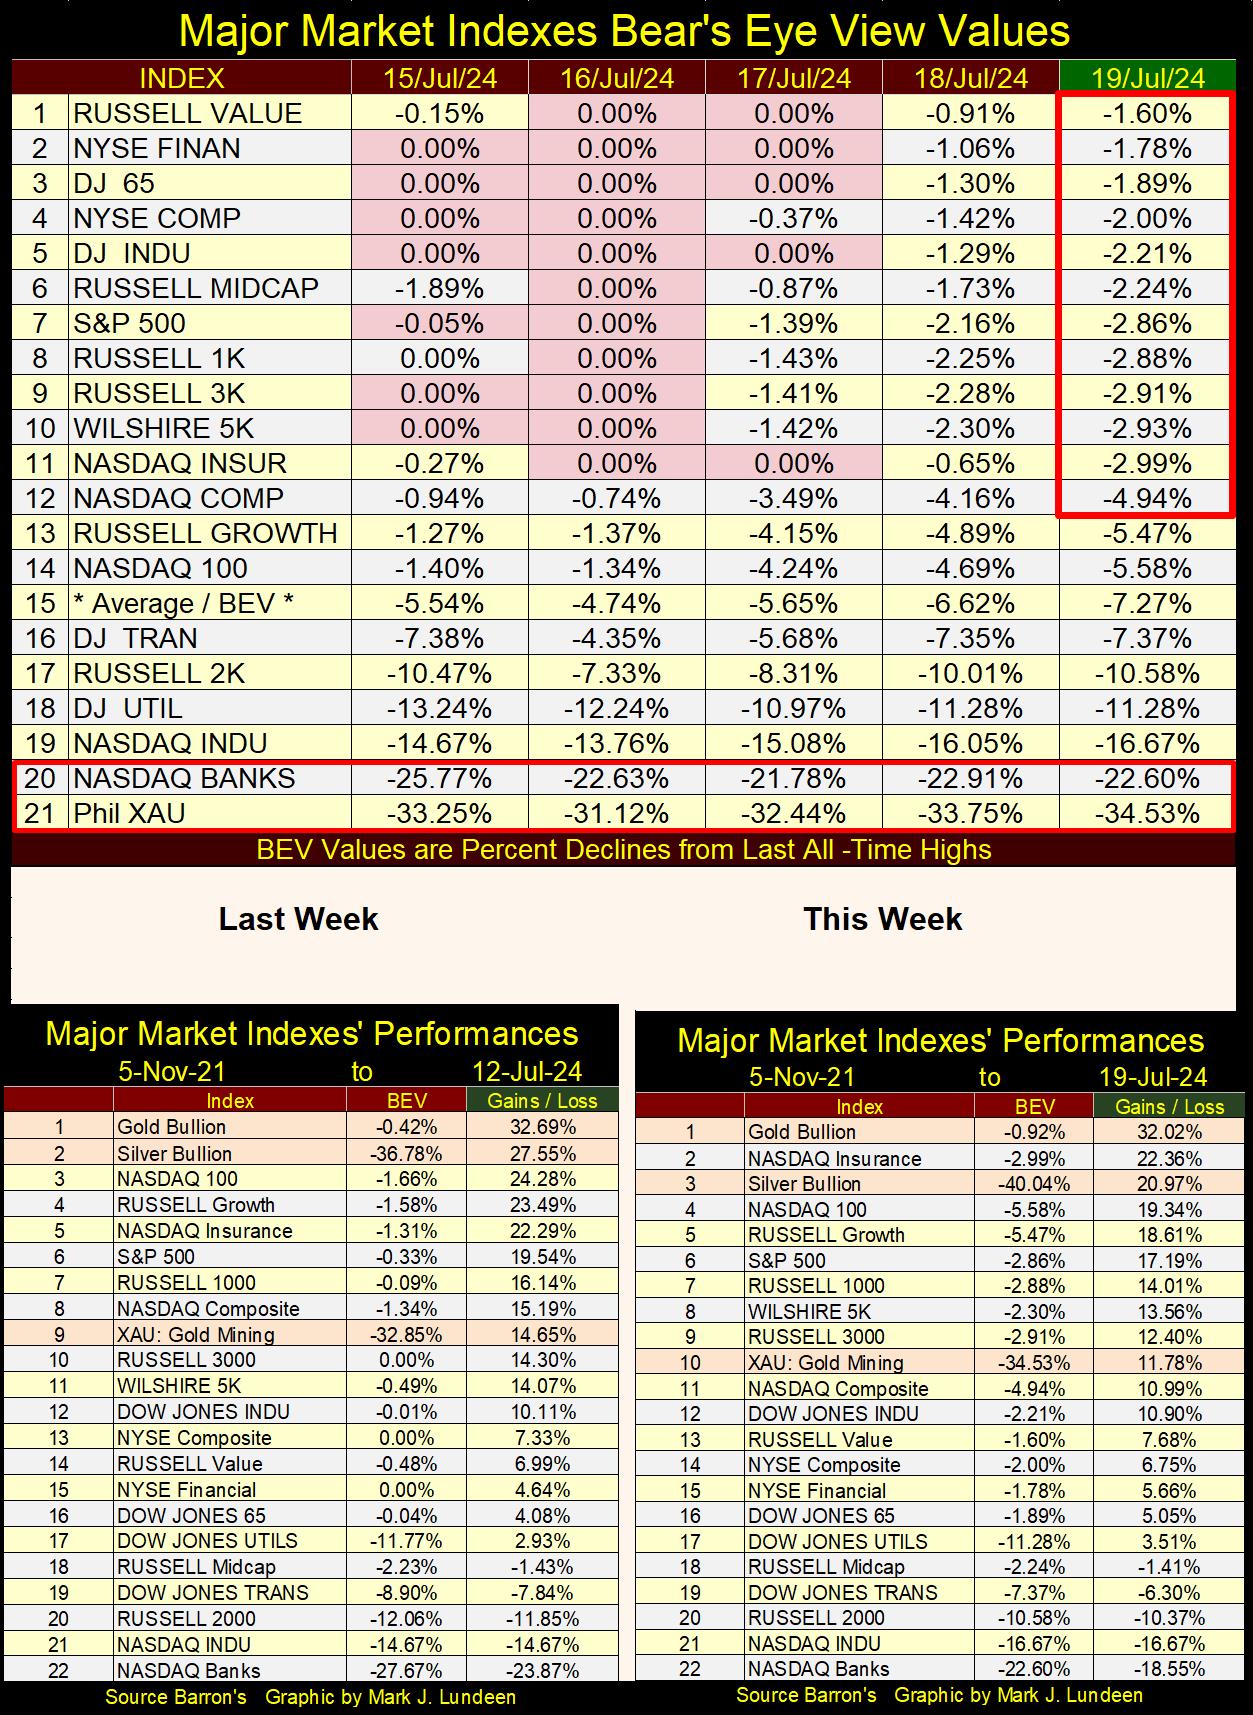
In the performance tables above, gold remained at #1, as silver and the XAU each slipped down a row in this week’s table. No matter, I remain positive on precious metal assets.
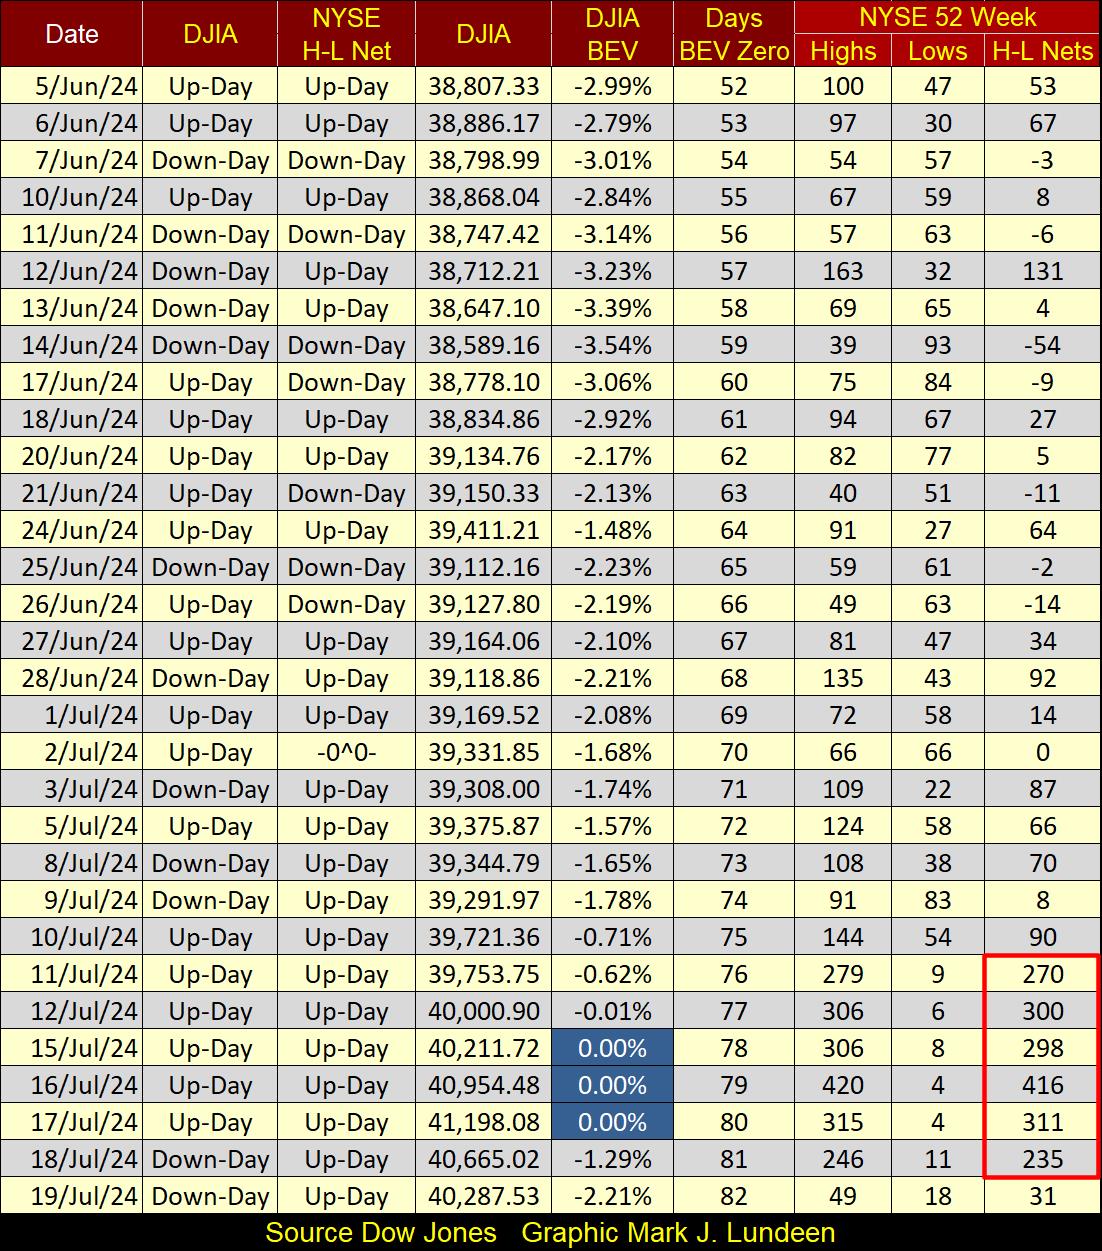
Looking at NYSE 52Wk Highs and Lows in the table below, since June 5th the market in terms of making new 52Wk Highs and Lows, was for the most part marched-in-place. Then came July 11th (inside red square), when the NYSE began seeing an increase in new 52Wk Highs, just as the Dow Jones began with its latest three BEV Zeros. If the market can keep this up in the weeks to come, this would be a very positive development in the market. Will it? I’ll let you know in the weeks to come.
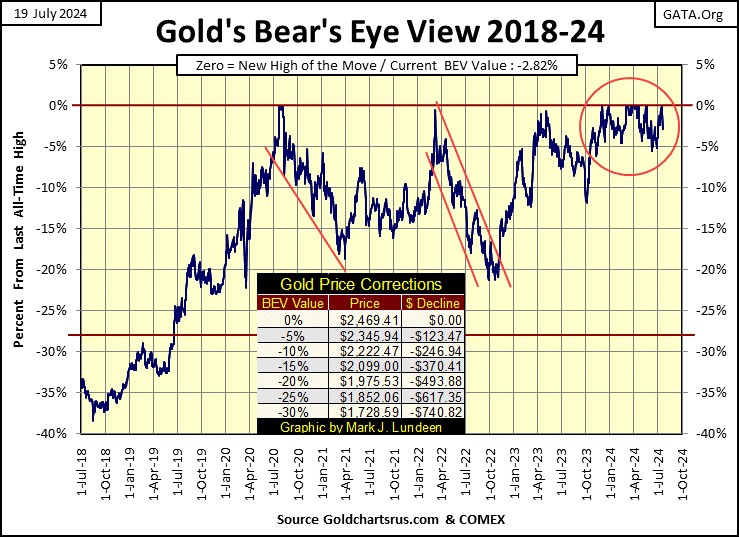
Moving to gold’s BEV chart below, gold looks good. In other words; this week gold not only closed in scoring position, but also saw another BEV Zero on Tuesday, its 24th since it began its current advance last November.
Sometime in the future, gold, silver and their miners are going to see a huge increase in daily volatility, BIG daily moves up. Unfortunately, we’re not there just yet. But looking at what gold has done since it bottomed in October 2022 below, and especially since last November when it close in scoring position, and remained there since, I can’t fault what is happening in the gold market.
Though truth be told; I want much more, such as gold closing well over $3000 and silver closing well over $50. It will happen. We just have to wait – damn it.
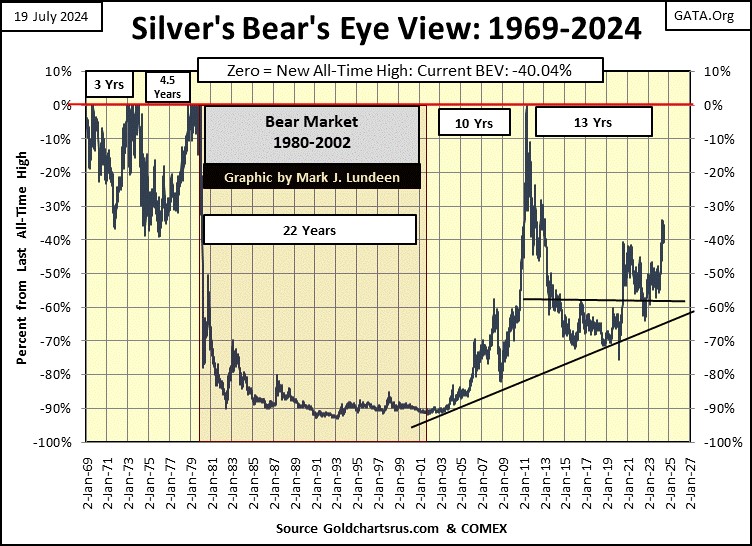
Next is a chart I publish every now and then, silver’s BEV chart going back to 1969. This week silver close with a BEV value of -40.04%, or 40.04% from its last all-time high. And when was silver’s last all-time high? January 1980, forty-four years ago. When silver finally breaks above $50 an ounce, with authority, what follows that close should be something to see. But don’t expect to see anything exciting in silver’s BEV chart, as any, and all new all-time highs are only equal to 0.00%, each a big fat zero to Mr Bear.
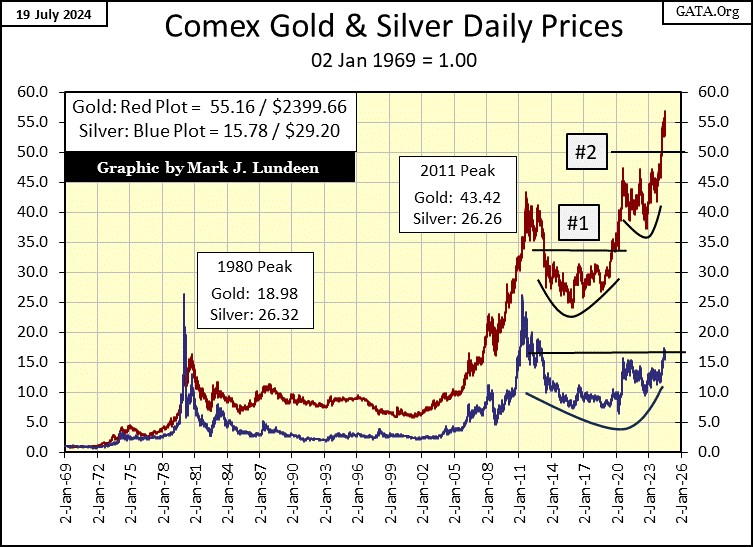
Below is an excellent chart for seeing gold and silver rise to stunning new all-time highs, where I’ve indexed both to 1.00 = January 1969. Doing so allows us to directly compare their performance to each other. Silver in 1980 outperformed gold, but has fallen far behind since. This week closed with gold up by a factor of 55.16 from January 1969, while silver is up by only a factor of 15.78.
Many market commentators I follow believe silver will ultimately catch up to gold, and then exceed it. I’m all for that! But for the past four years, silver has been struggling with clearing its resistance at 15.5. That can change in a single day, where suddenly silver is well above its 20-factor line, hopefully soon.
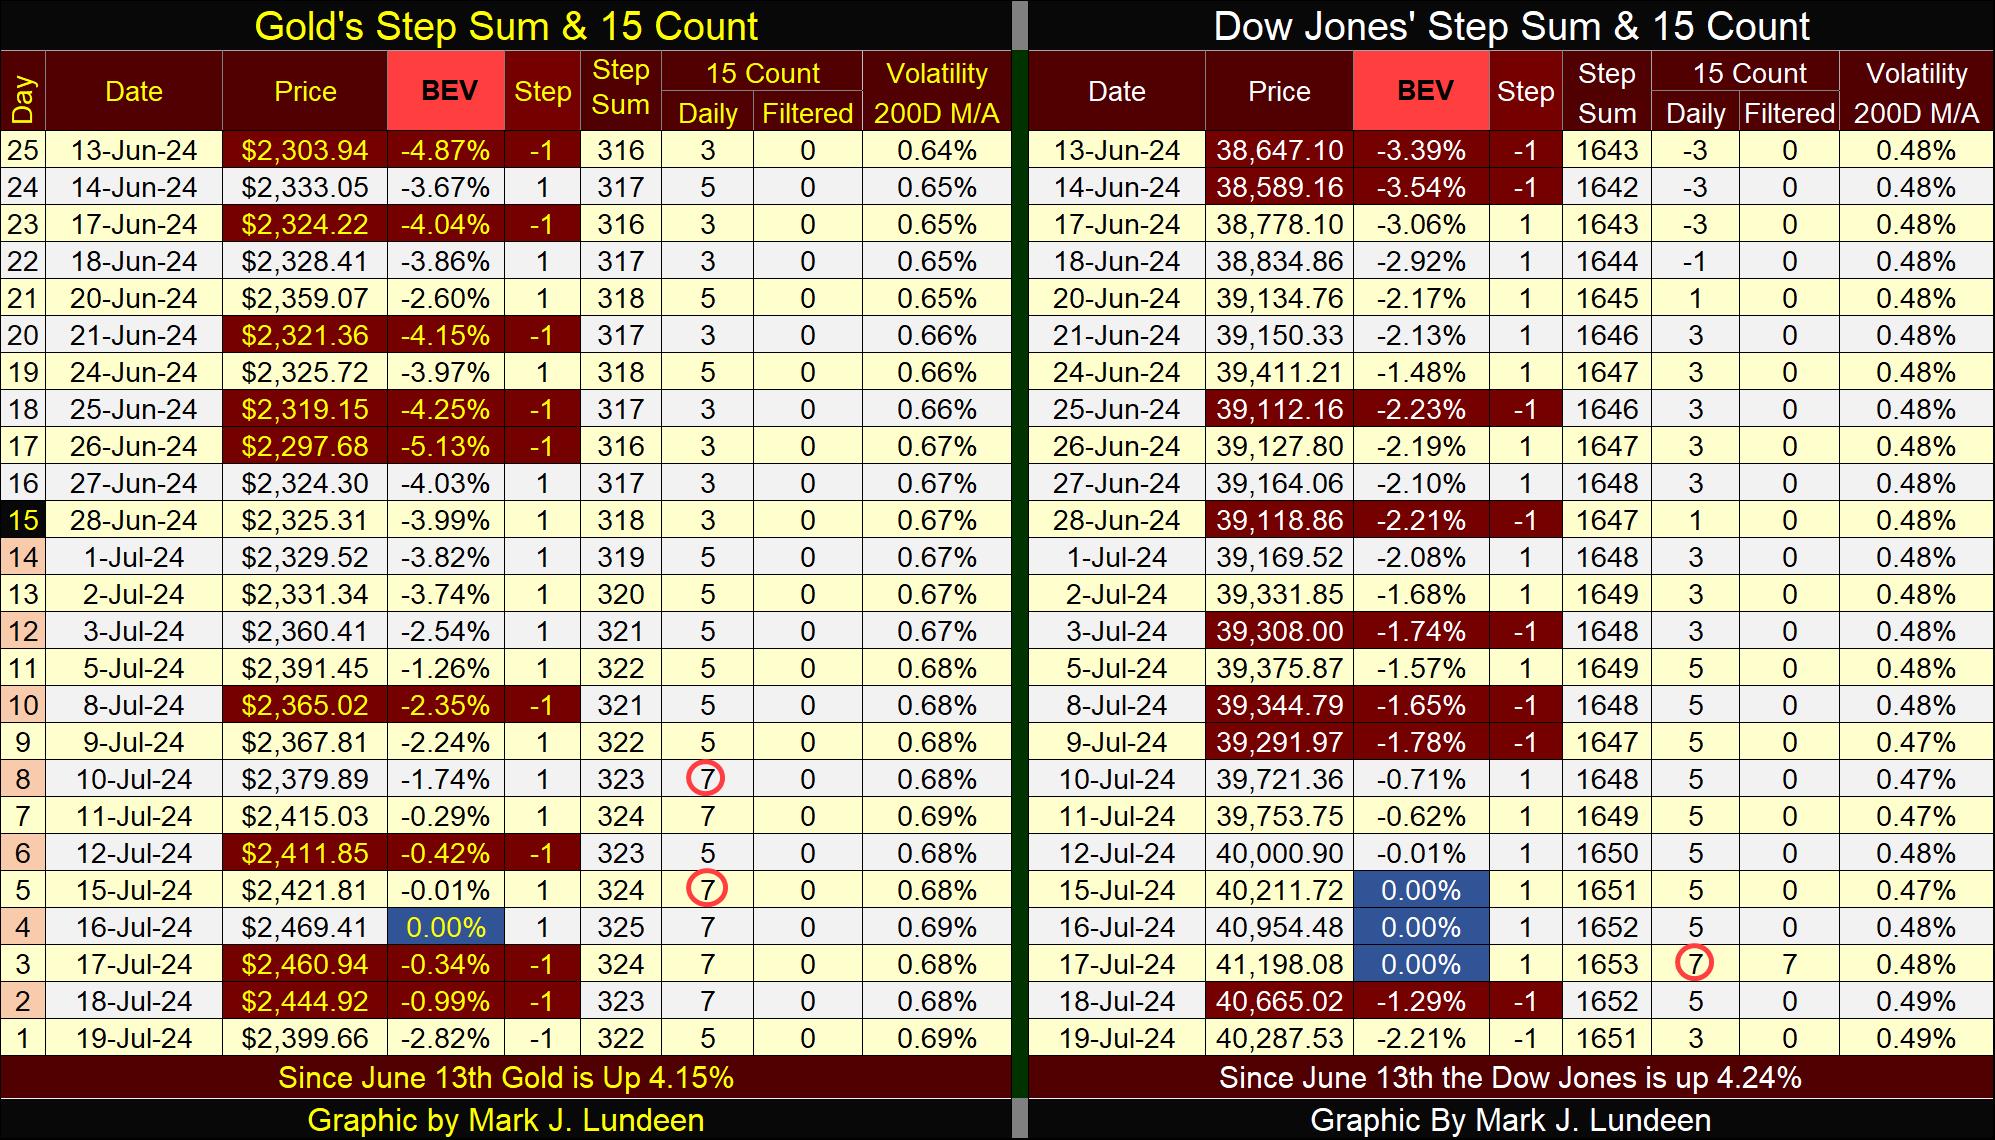
Next is gold’s step sum table. I note gold’s daily volatility’s 200D M/A closed the week at 0.69%, up from 0.64% from June 13th. I like that, as precious metal bull markets are exciting markets, markets with BIG daily moves, both up and down.
On July 10th, gold became overbought when its 15-count increased to a +7. Markets don’t like being overbought, so I’m not surprised seeing an increase in daily declines in the gold market. At week’s close, gold closed with a 15-count of +5. Seeing gold’s 15-count decline a bit more, with additional down days would not be a bad thing in the next few weeks.
On the Dow Jones side of the step sum table, its daily volatility’s 200D M/A is also inching upward, but not enough to think much of it. That is bullish, as the worse thing that can happen to a bull market for stocks, is to see daily volatility rise for the Dow Jones.
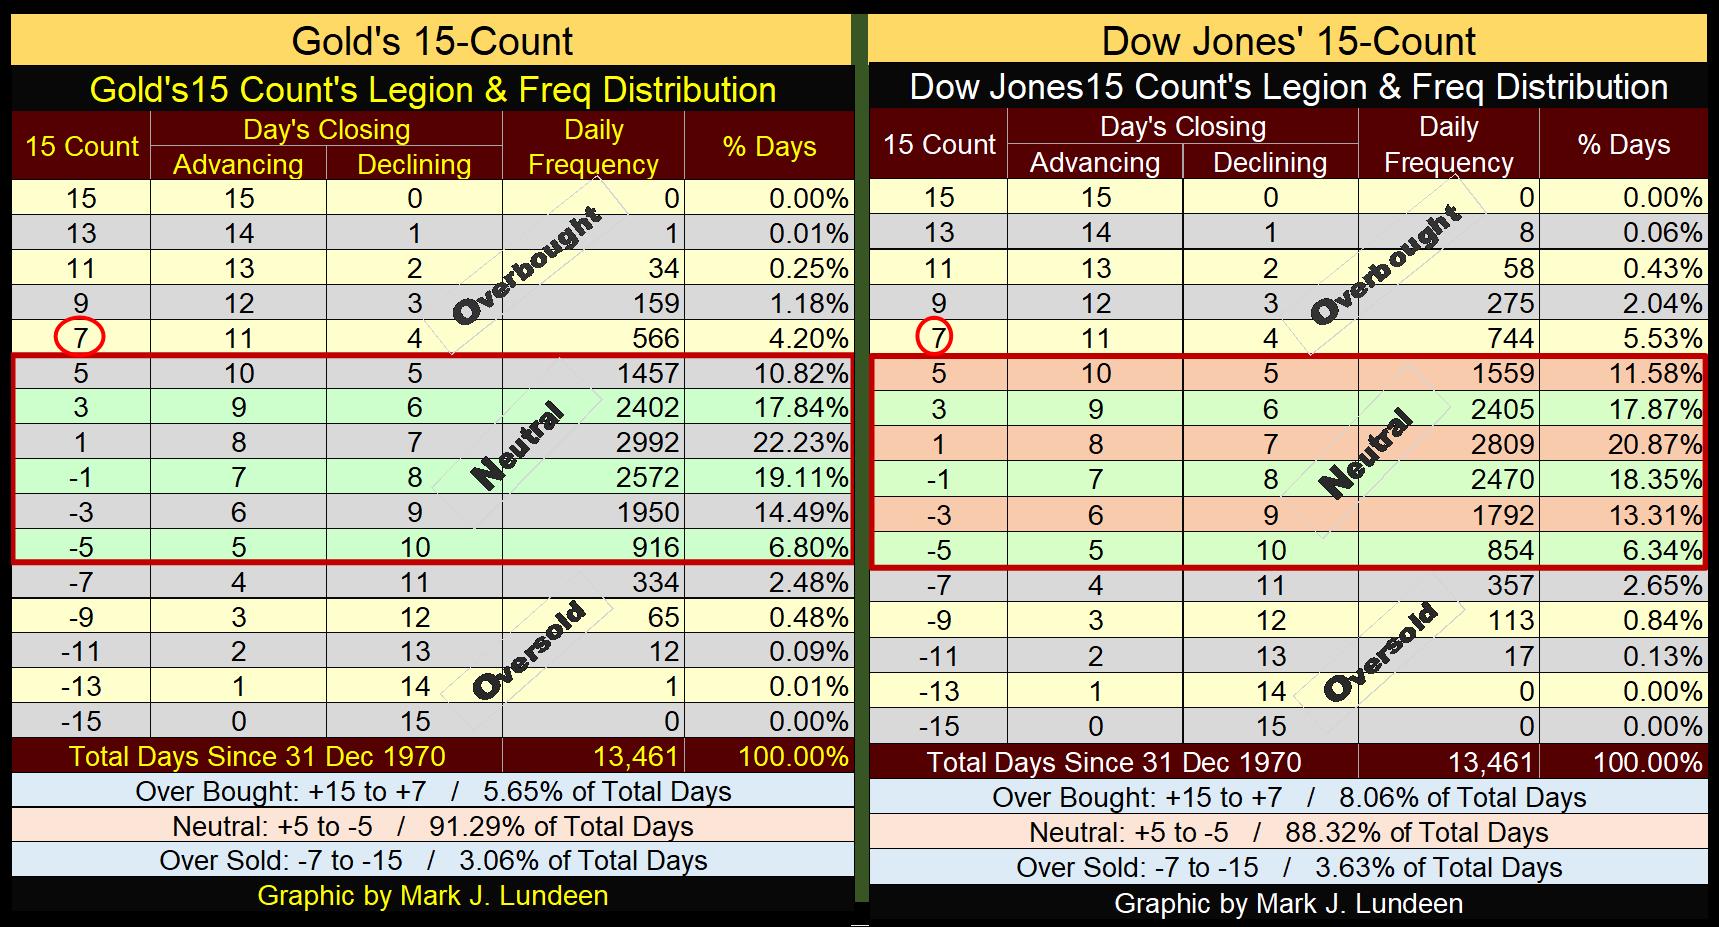
This week, let’s go deeper into the a step sum’s 15-count, when gold and the Dow Jones are overbought or oversold, in the tables below. The base data used in constructing these tables are daily advances and daily declines, since 31 December 1970. Each daily decline is = -1, daily advances = +1.
The 15-count is a running 15-day sample, a sum of the daily steps (-1s & +1s), as seen in the tables below.
A 15-count of +15, is a sample of fifteen daily closes, each a daily advance of +1. In the tables below, since December 1970, neither gold or the Dow Jones have seen fifteen consecutive daily advances.
A 15-count of -15, is a sample of fifteen daily closes, each a daily decline of -1. In the tables below, since December 1970, neither gold or the Dow Jones has seen fifteen consecutive daily declines.
But both gold, and the Dow Jones have seen one 15-count of +13, which are 15-counts with fourteen daily advances, and one daily decline, in their running fifteen day samples. They’ve also seen one 15-counts of -13, which are 15-counts of fourteen daily declines, and one daily advance, in their running fifteen-day samples.
Take a moment to study these tables. They’re not hard to understand, but they are interesting. Note; this week both gold and the Dow Jones saw their 15-counts at a +7 (Red Circles).
Why should anyone care about running samples for daily advances and declines? The table below will answer that question.
Since 02 January 1900, to 19 July 2024 (124 years) the NYSE has seen 33,604 trading sessions. Of which, 17,627 saw the Dow Jones advance, and 15,977 saw the Dow Jones decline. That is a net of only 1,650 daily advances in the past 124 years. 1,650 net daily advances that has taken the Dow Jones from 68.13 on the close of 02 January 1900, to 40,287.53 on the close of 19 July 2024.
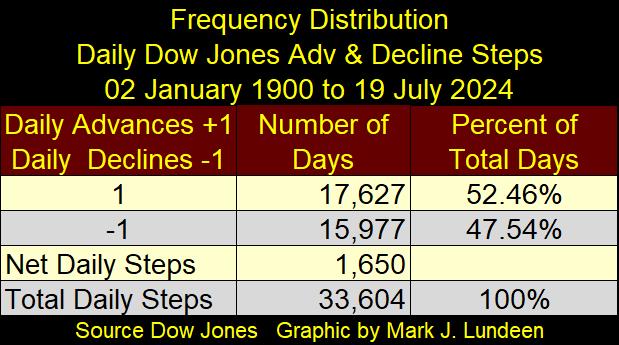
In other words; come bull or bear markets, the Dow Jones sees about as many daily advances, as it does daily declines. In terms of a 15-count, the Dow Jones has seen a 15-count of about +1, for the past 124 years of Dow Jones history. I find it interesting when the Dow Jones, or gold’s 15-count finds itself in extremes, which in the 15-count tables above, I’ve defined as any 15-count above +5, or below -5.
This week, both gold and the Dow Joens’ 15-counts were +7, which I’ve defined as being overbought, for the good reason gold has seen a 15-count of +7 on only 566 of its 13,461 daily closings since 1970, and the Dow Jones only 744 of its 13,461 daily closings since 1970.
I’ve found following a market’s 15-count provides a good, but not perfect insight of what is to come on a short-term basis. Seeing gold, or the Dow Jones’ 15-count at an +7, or worse, an extreme of +9, or +11, strongly suggest the market is due for a pullback. As would seeing a 15-count of -7, or an extreme of -9 or -11 strongly suggesting a bounce, in a market decline.
Seeing a 15-count of +/-13, or higher is very rare, suggesting something important in the market may be soon at hand. Gold’s one 15-count of -13 happened on 17 November 2015, at the bottom of the August 2011 to December 2015, 45% bear market. Gold’s 15-count of -13 in November 2015, signaled the four-year bear market was at a point of exhaustion, and would soon bottom.
It's interesting noting silver, on 18 November 2015, saw its 15-count decline to an incredible -15: fifteen consecutive down days, three weeks of uninterrupted daily price declines in the silver market! Silver, like gold, soon bottomed, and began an advance that continues to this day.
Mark J. Lundeen


