The Coming Stock Market Horror Story
I like this chart of the Dow Jones. BEV points to the left, Dow points to the right. Note how both views of the Dow, one in percentage points from the Dow's Terminal Zero (last all-time high), the other in dollars, exactly overlay each other. It will stay that way until the Dow Jones makes a new all-time high, which would print a new BEV Zero on the upper red line. When will that happen? Hope springs eternal on CNBC that the Dow will do just that sometime in 2011, but not in anything I write.

First: even if the Dow does reach a new all-time high, the supply of dollars and credit created by the Fed have exploded since the Dow saw its last all-time high in October 2007. Let me tell you a little secret that the "policy makers" don't want to get around: it's their inflation that makes your bull market in stocks, and right now the "policy makers" are having difficulty pumping their "liquidity" into the financial markets, and away from consumer prices and precious metals.
Second: if the Dow fails to make a new all-time high……. well, we'll examine the horrific implications of that after we look at the table below.
Even if the Dow was successful in taking out the last 12% of its 2007-09 losses, and moved on to new highs, its gains would still be far below those in gold, silver and the Barron's Gold Mining Index. All the major stock market indexes are running like an aging nag racing with two-year-old fillies at the Kentucky Derby. A new all-time high in the Dow Jones, FOUR YEARS AFTER THE HIGHS OF 2007, isn't going to change that. Currently, the Dow is having difficulty keeping up with the bull market in cauliflower at my grocery store.
Everyone is talking about how high the price of silver has risen recently. But allow me to note that silver's percentage gains have only kept pace with the increases in the Fed's balance sheet since October 2007. "Financial Experts" should not find fault with an inflation hedge that actually keeps up with inflation, but in 2011, they do. Will silver continue to outperform gold and mining shares? I think it will, for a while. One thing to keep in mind is just how small the silver market is, compared to the market in gold. This means that in a world where "trillions-of-dollars" is now an all too frequently used term in private and public finance, ten million dollars can still have a big impact in the silver market, * if * the ten million dollars insists on taking delivery of physical silver metal.

But even if you toss in the gold market and the mining shares, the entire precious metals complex is tiny when compared to the grossly inflated financial markets. Since 1982, financial assets have exploded not only in price, but in variety and quantity of instruments trading in the public markets. Feeding on the "liquidity" flowing from the Fed, the stock market has seen many new IPOs, secondary offerings, and stock splits. How many times in the past three decades has Tiffany's (the big NY jeweler) been purchased, and delisted from the stock exchange, only to be offered to the public as an IPO sometime later? At least twice. Well, the money used to take Tiffany's "private" was inflationary funding, as was the money that made its subsequent IPOs so successful. But, except for providing ample profits for Wall Street's financial engineers, Tiffany's itself was little changed except for raising prices to its customers, and likely lower benefits for its employees.
For a very long time now, Wall Street has been hard at work making one dubious deal after another, slicing and dicing corporate America into little pieces, and then sewing their captive corporations back up into new patterns, all financed by inflationary funding. So like a sponge, the financial markets have absorbed trillions of dollars since 1982, as the precious metals were wrung dry from 1980-2000. To my way of thinking, the 10 year gains we've seen in the precious metals complex is just the start of a massive inflow of "inflation" coming its way, when the financial markets begin to deflate. Looking at the markets in this way, (and it's the way we should), the question on our minds should be for how much longer will gold and the mining shares continue to lag silver?
What happens when the day comes when just $1 trillion of the $14 trillion dollars in the US Treasury market decides to move into a 5000 year old asset class that has been appreciating for ten years? It won't all be going into silver and soybeans. In their own good time, gold and the mining shares will also provide their owners with bragging rights.
Now, onto the "horrible possibilities", should the Dow fail to make a new all-time high. Mr. V, from a well visited gold and silver internet site, sent me an article on the huge, eleven year Head and Shoulders (H&S) formation the Dow is currently completing. This is one UGLY chart!
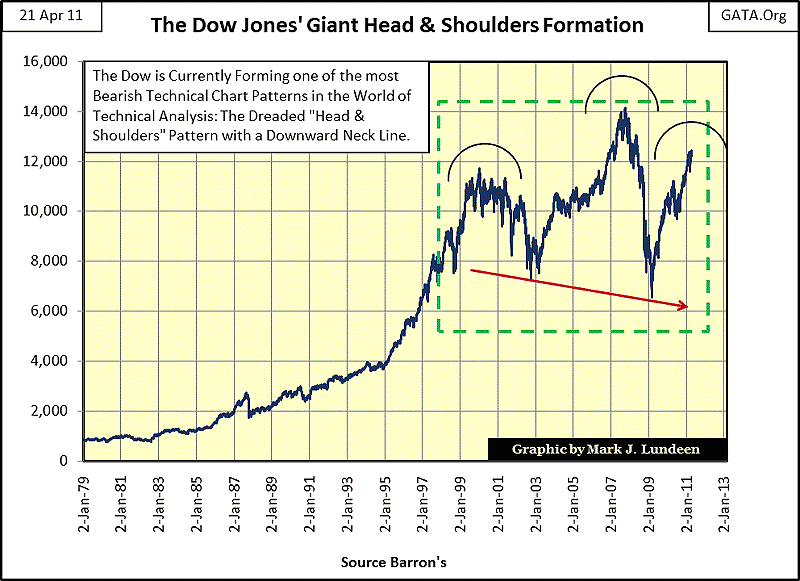
I've placed three arcs in the chart. The arcs over 2000 & 2011 are the left and right shoulders of the formation, and the highs of 2007 form the head. I also included a red "neck line" under the lows of 2002 & 2009.
The theory behind the H&S formation is simple to understand, and entirely logical: we are examining the flow of funds into an asset as it advances and corrects during an aging bull market. If the right shoulder (our current advance) fails to rise above the "Head" of the pattern (the 2007 highs), then the bulls just don't have the stamina to overpower Mr Bear, and the path of least resistance is down to new lows. The declining neck line suggests that the new lows, should they occur, will fall below the lows of March 2009.
Remember, dealing with market-price trends is more art than science. But in the art of technical analysis (TA), the H&S pattern has a * high probability * of predicting the future down-trend in a market. Having said that, the reliability of TA as a market forecasting tool would be greater without the wild card of Fed manipulation thrown in (fixing interest rates near zero for over two years, massive intervention in the Treasury bond market, etc). With that understanding, this chart is saying that if the Dow doesn't make a new all-time high before it starts a serious correction, which in my opinion it looks overdue, the likelihood of the Dow dropping below its lows of March 2009 is very high. In fact, the article Mr. V passed on to me predicted that if the Dow dips below its neck line, it could go all the way down to the basement! And just where would that be in dollar terms? Well the article said "ZERO", but I'm not that bearish as I look to the Dow's dividend yield for clues of what is ahead for the Dow Jones, and the stock market in general.
Now, if you still think that dividends are not important, it's only because you're a bull in the stock market, and bulls don't give a sweet rat's petutti about dividends! Why is that? Because bulls are only interested in big double-digit capital gains! But in the history of the stock market, single-digit annual losses are far more numerous than the rare double-digit gain. After sufficient time has passed, the bulls come to understand that maybe their expectations are unrealistic. Bulls, who typically run around the markets as a herd of unreasoning beasts, can cause a sudden market crash when they decide to exit the market the same way they came in - as a group in full stampede. On the other hand, bears are a different animal altogether. First of all, unlike a dumb cow, bears can do math!
Let's look at the table below, which shows the relationship between the valuation of the Dow Jones to its cash payout and dividend yield. These are simple mathematical relationships. With the Dow Jones Closing this week at 12,453, paying $294 in dividends, its dividend yield at the close of 21 April was 2.36%.
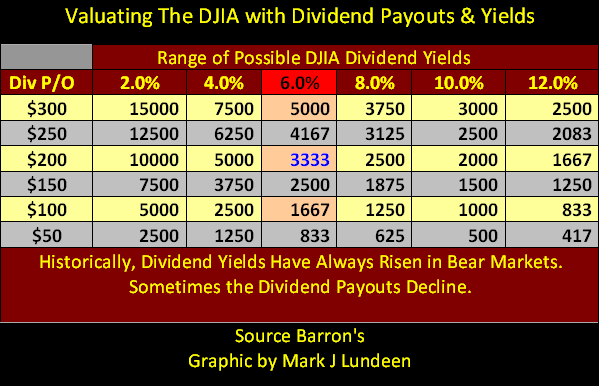
But what would happen to the valuation of the Dow Jones, if its current cash payout slipped to $150, while the Dow's yield increased to 6%? Seeing the Dow Jones half its dividend payout, and its yield rise to 6% is nothing unusual, historically.
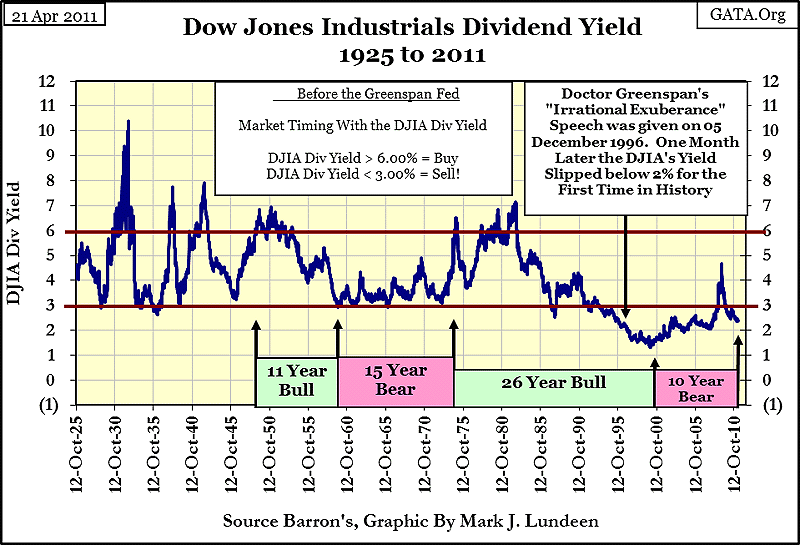
From 1929 to 1932, the cash payout for the Dow fell 90%, while the dividend yield climbed to 10%, so I'm not taking an extreme position here. No matter; if today's Dow's payout was reduced to only $150 a year, and its yield increased to 6%, that would fix the value of the Dow Jones at 2,500; far below the Dow's current 12,400, and 82% below its highs of October 2007! It's amazing what halving the cash income from the Dow and a 6% yield can do to destroy the value of an investor's portfolio. But Doctor Greenspan inflated a massive bubble in the stock market that to date has not been allowed to deflate to realistic valuations.
Look at the chart above. From 1925 to 1987, Dow Jones' bull and bear markets all occurred between the Dow's 3% & 6% dividend yields lines. Bull markets started with the Dow yielding something over 6%, and for 62 years, when the Dow's dividend yield hit its 3% line: the party was over. The last time this rule took effect was in 1987, when the Dow's dividend hit its 3% yield line in February. So, the Crash of October 1987 occurred seven months after the Dow's dividend rule signaled BEAR MARKET. Guess what? Bad things happen in the stock market during bear markets. Had the natural forces present in the stock market been allowed to take their course, market history (as seen in the chart above) would have taken the Dow Jones down to a valuation where it was once again yielding 6%.
But Doctor Greenspan had a problem allowing market forces determining market valuations. The Dow was allowed to correct up to its 4% yield line in 1990, before his massive waves of "liquidity" flooded Wall Street. Ten years later in January 2000, the Dow was yielding an incredible 1.32%! The implications are horrific!!
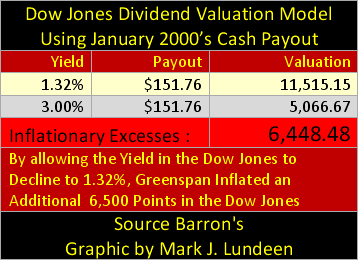
As displayed in the table above, had Doctor Greenspan respected the Dow Jones 3% Dividend rule, the stock market would have topped out at 5000. BUT by pushing the Dow until it yielded the miniscule 1.32% it saw in January 2000, he added an additional 6500 points in the Dow Jones. In an earlier article, I reexamined Doctor Greenspan's "irrational exuberance", and I think I made a strong case that he was very aware of the implications of the Dow Jones yield falling below 3%. But he continued inflating his bubble in the stock market, fully aware of what we see in the table above.
Well, Mr Bear wants all those Dow Jones Points back; plus the Dow Jones Points Doctor Bernanke added at the October 2007 high, in addition to as many Dow Points as it takes to drive the Dow's dividend yield back above the 6% line. Earlier I showed that a 2500 Dow was possible, but the only reason such a decline today would be so horrible is because Doctors Greenspan and Bernanke drove the Dow Jones far above 11,000! What this implies for the future valuation of the Dow Jones is best understood by taking a second look at my first dividend table above. That table shows the inflexible mathematics of a Bear Market.
Most people currently can't even comprehend possible declines on this scale. But let's face it, people still in the stock market today are bulls, and as noted before, bulls don't give a sweet rat's petutti about dividends. What bulls reallywant are the capital gains now flowing into silver. But the table above gives us a more realistic outlook of what is in store for anyone who overstays their welcome in the stock market:
- declining cash payouts
- increasing dividend yield for the Dow Jones
- massive losses in personal wealth
If Mr Bear were to repeat the job on the Dow he did during the Great Depression, resulting in a 90% reduction in cash payouts with a 10% yield, he could drop the Dow down to a tiny 294, still substantially better than the "Zero" predicted by the author of the H&S article.
Hmmm; is that a H&S pattern forming in the Dow's dividend payout? Why yes it is!
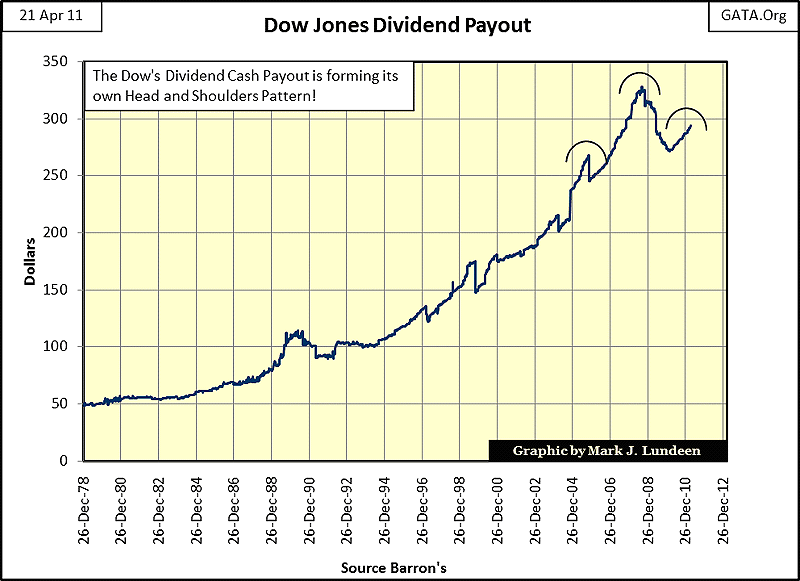
Personally, I don't believe the economy, or the businesses that operate within it, are doing as well as the financial media would have us believe. Washington keeps getting bigger, draining more money from the private economy. And what does the economy receive in return for the taxes it pays the government? More rules, more regulations, more red tape, and let's not forget all the money poured into academic economic research to justify fouling the monetary water table with the Fed's polluted "liquidity." I doubt the 2007-11 bear market in stocks is over yet, not by a long shot.
So, I ask myself: what's the worst thing that could happen today, the one thing that inspires fear and loathing in the hearts of the "policy makers.?" That's a good question to ponder, because in bear markets, that's the question Mr Bear always asks, as he calculates the most effective way of inflicting as much pain and misery as he possibly can. My answer to that question is: rising interest rates. Right now, rising rates would blow down the house-of-cards currently supporting the financial markets and economy. Rising rates, both long term and short term, would kill the bond market, and historically, as bond yields go, so goes the yield of the Dow Jones Industrial Average.
Don't expect heavily indebted companies to maintain their cash payouts when long term rates for AAA-rated debt approach 10%. When a company gets into financial difficulties, the first thing that gets cut is their dividend payout to shareholders. Here is where Mr Bear's dividend valuation model takes the control of the stock market's pricing mechanism and down goes the bond and stock markets. Hard-core stock market bulls out there currently aren't concerned, but we chickens all know what this means:
- Declining financial assets valuations result in rising rates and yields.
- Rising rates and yields expose the financial positions of public and private institutions to scrutiny. Questions soon arise about their survivability, which cause the markets to raise risk premiums for bonds, and motivate an increasing number of cash-strapped companies to cut their dividend payouts.
So, this goes on and on until the financial markets find a bottom, which in our case will be far below the highs of October 2007, and the lows of March 2009.
This is scary stuff to contemplate, but what makes me think interest rates and yields will increase? Well, I think it's obvious that without interference in the stock and bond market, sanctioned at the highest levels of government, the financial markets would have continued to deflate in March 2009, instead of turning around. Doctor Bernanke isn't making any secret of this:
"Policies have contributed to a stronger stock market just as they did in March 2009, when we did the last iteration of this. The S&P 500 is up 20% plus and the Russell 2000, which is about small cap stocks, is up 30% plus." -- Doctor Benjamin Bernanke, CNBC Interview with Steve Liesman 13 Jan 2011
Anyone unaware of the commitment the Federal Government has made to defend current valuations in financial assets just isn't listening to what the "policy makers" are saying on CNBC, and elsewhere. Here is an oldie but goodie from decades ago:
"The last duty of a central banker is to tell the public the truth." -- Alan Blinder, Vice Chairman of the Federal Reserve
Now this was quite a "policy statement" from Doctor Blinder; and yes, he did say that; I watched him say it. When Doc Blinder (a see-no-evil type of guy) was first appointed to the Federal Reserve Board, he didn't miss an opportunity to say precisely this on PBS's Nightly Business Report or to anyone else with a video camera, who cared to broadcast his opinions to a public he had nothing but contempt for.
So what are these "policy" dudes doing to the dollar now? I must admit, they have exceeded my expectations of the extremes in skullduggery they are capable of: to maintain low interest rates on the long end of the bond market The Fed is selling Put Options on US Treasury bonds.
Go to the link provided for the specific details, but basically, the Federal Reserve is repeating the market strategy that got AIG into trouble; selling insurance on financial assets without maintaining adequate reserves, should the market demand payment on the insurance (although the Fed can always print up the money needed to cover their recklessness). But don't think this would go unnoticed!
"We hate you guys. Once you start issuing $1 trillion-$2 trillion [$1,000bn-$2,000bn] . . .we know the dollar is going to depreciate, so we hate you guys but there is nothing much we can do." -- Luo Ping, a director-general at the China Banking Regulatory Commission, 11 February 2009
This action (selling puts on T-Bonds) encourages bond buyers to purchase US Treasury debt at lower interest rates than they would, if they could not hedge losses by bundling a put with a bond.
This is exactly as if Larry, a well know man about-town, and last of the big time spenders, after spending all of his own money, and that of those who lent him theirs, becomes concerned that his creditors are going to raise their interest rates on his paper, fearing that he may default on his debts. So Larry tells his creditors that there is no reason to raise rates on his loans, not if he promises to make good any losses his creditors might experience with "insurance" (which his creditors must pay for themselves) underwritten by the man about-town; Larry himself. This is crazy, but we are living in crazy times!
This "long bond put policy" makes it impossible for the Fed to raise short term interest rates, or withdraw its support of the bond market, as rising yields WILL FORCE the Fed to print even more money, to cover the puts they wrote on the US T-bonds! QE3 or not, we can count on continued Federal Reserve support for the US bond market, if for no other reason than to keep the puts it wrote on US T-bonds from paying off. This action by the Fed is their guarantee to all Gold-Bugs that the bull market in gold and silver has a LONG WAY TO GO!
But have no doubt, Mr Bear is fully aware what the Fed is up to. Before he's finished with the "policy makers", Interest rates will rise to double digits, and the Fed will have to continue printing money in ever increasing quantities until the dollar becomes worthless. None of this is any good for the Dow, or even for everyone's favorite stock, Apple. All things considered, there has never been a better time to exit the stock market, and pick up as many ounces of gold and silver as you can get your hands on.


