Global Markets Crash Warning
Dow Danger Chart

• Most global stock markets are struggling. Major tops take time to form, and the rollover can be subtle
• The US market has held up quite well, until April. Now, heavy distribution volume is making an appearance.
• Note the MACD indicator. That is showing a continuous breakdown, and setting the stage for deeper declines.
Japan Stock Market Crash Chart

• Japan’s stock market looks like pint-sized towering inferno.
• Horrifically, the crash has helped build a massive head & shoulders top pattern.
• The target on this index chart is the 100 level. If it is hit, Japanese investors would be crushed, and I believe some of them would turn to gold!
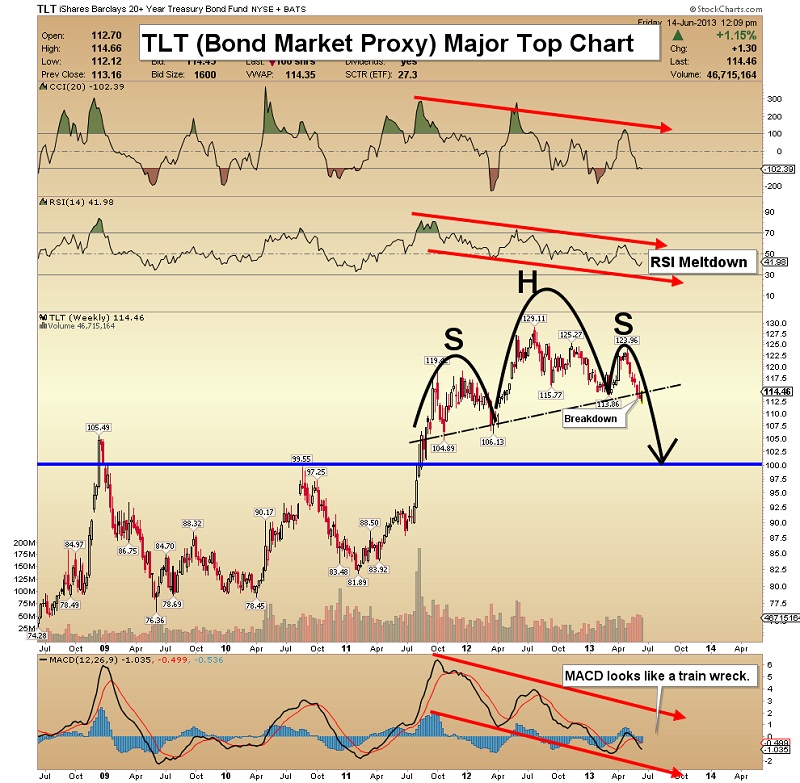
TLT (T-Bond Proxy) Major Top Chart

• Most technical indicators have been warning that something is wrong with the T-bond.
• In particular, MACD could be termed a technical “train wreck”.
• Bonds have rallied strongly, for 30 years. Quantitative easing has forced yields lower and lower. From here, even a modest decline in bond prices could cause a panic in global markets.
• The US bond market has formed a substantial head & shoulders top on the weekly chart, and recentlybroke the neckline.
US Dollar Rounding Top Chart

• When the bond market goes down, yields go higher. That usually supports the underlying currency.
• The dollar is now falling while rates are rising. The appearance of this rounding top pattern is disturbing chart action, and suggests there is a growing loss of confidence in American fiat currency.
Gold Triangle Chart

• Gold has been a little disappointing in the last week, but a short-covering rally could quickly take gold up towards $1580.
• From there, a fall to new lows in the $1250 area can’t be ruled out, unfortunately.
• Volume will be the key in interpreting the gold market in the coming weeks.
• Patience is required. The triangle formation suggests that gold is either headed towards $1580, or down to $1200. Let’s cheer for the bulls!
GDX Sentiment Extremes Chart

• Gold stocks are hated by most investors, which is an opportunity for the long-term investors with patience.
• When investor sentiment is radically lopsided, prices can quickly move in the opposite direction, and in this case that would be to the upside.
• This chart highlights my sentiment indicator. In 2008, prices kept falling, even though sentiment reached extreme levels. Regardless, the entire $25-$40 area seems to represent good value for sentiment players.
GDX Moment Of Truth Chart

• An inverse head and shoulders bottom pattern is in play. The right shoulder is almost complete. That’s bullish, but I want to see a two day close above $32, before getting too excited.
• The upside target is $37. Volume patterns are more constructive for gold stocks than for bullion. Gold stocks could lead the metals higher, which would be a welcome change!
GDXJ Trend Line Action Chart

• My next target price for GDXJ is $16.
• The formation of the right shoulder of the inverse h&s bottom is good news, but the price is back down below a key trend line, which is a little disturbing.
• Junior gold stock investing is not for the faint of heart, and all investors can do is hope that the juniors follow the senior stocks up the chart!
Silver Chart

• From a technical stand point, MACD is acting like it wants to turn higher.
• When silver was peaking two years ago, almost nobody wanted to sell the white metal. Today, there are few buyers.
I added physical positions this week, in my $19-$23 buy zone. Although I own more gold than silver, I think silver may surprise investors, by holding the recent lows, while gold breaks them.

Unique Introduction For Gold-Eagle Readers: Send me an email to [email protected] and I'll send you 3 of my next Super Force Surge Signals, as I send them to paid subscribers, to you for free. Thank-you!
Stay alert for our Super Force alerts, sent by email to subscribers, for both the daily charts on Super Force Signals at www.superforcesignals.com and for the 60 minute charts at www.superforce60.com
About Super Force Signals:
Our Super Force signals are created thru our proprietary blend of the highest quality technical analysis and many years of successful business building. We are two business owners with excellent synergy. We understand risk and reward. Our subscribers are generally successful business owners, people like yourself with speculative funds, looking for serious management of your risk and reward in the market.
Frank Johnson: Executive Editor, Macro Risk Manager.
Morris Hubbartt: Chief Market Analyst, Trading Risk Specialist.
Super Force Signals
422 Richards Street
Vancouver, BC V6B 2Z4
Canada


