Gold Market Update
Last week we got the expected relief rally in gold and silver and closed out profitable Call option trades mid-week as the rally topped out. Following the violent plunge the week before, the relative tranquility of the past week has provided an opportunity to reappraise the situation, and the implications of the plunge, which only a week ago had been thought to be just the steep initial phase of a correction that has already largely run its course, are now thought to be considerably more bearish for the intermediate term than was previously the case.

Several weeks back a commodities bust was predicted on the site as a result of the study of the charts of the big iron ore producers. Immediately after that article was posted commodities went into a steep decline, and that included gold and silver as we know.
Up until now it has been assumed that gold and silver would be relatively immune from a bear market in commodities generally, due to their appeal as a safe haven during periods of extreme uncertainty. Base and industrial metals would suffer from a drop in demand in the event of recession/depression, but gold and silver, as “real money”, would remain attractive at a time when there would be few investment alternatives. This is now considered to be wishful thinking - and not just wishful but dangerous.


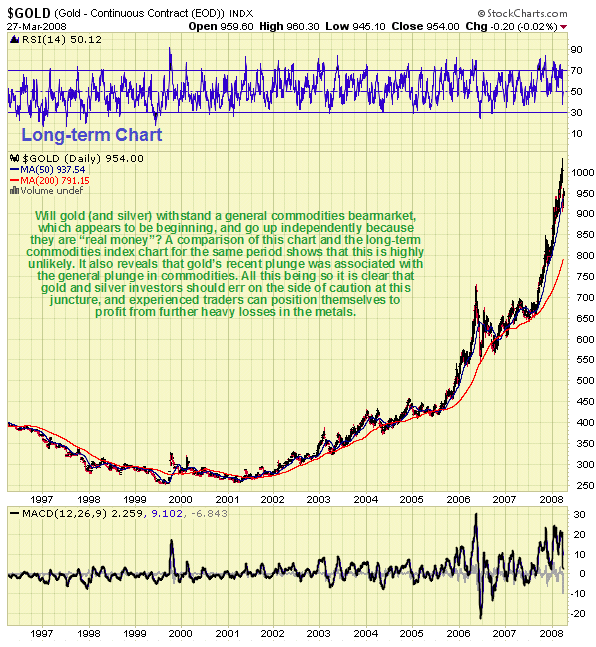
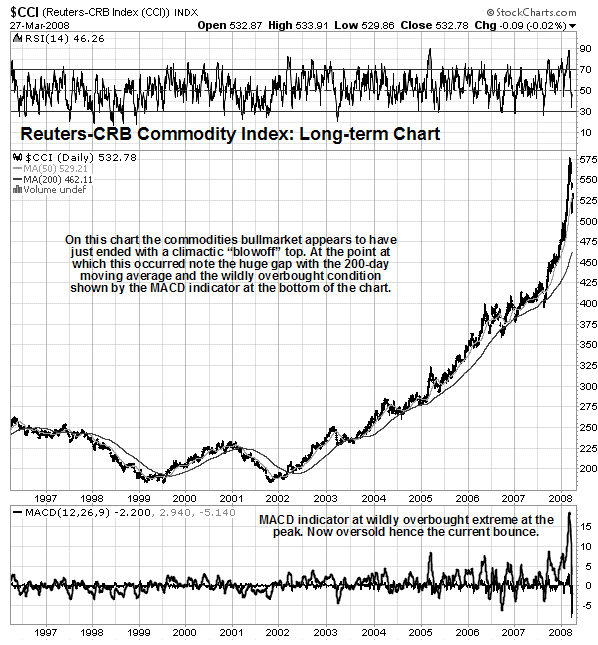
A direct comparison of the long-term chart for the Reuters - CRB Commodity Index and that for gold going back to the mid to late 90’s shows a strong correlation, which was emphasized by last week’s plunge by gold and silver in tandem with commodities generally. The commodities chart shows prices descending swiftly from a climactic “blowoff” top, where an extremely overbought condition existed after a period of near vertical ascent. The remarkable parallel visible on the gold chart means that this is what we have just witnessed in gold too, and if so, we are likely to see further heavy losses in gold, silver and Precious Metals stocks before much longer. The least we can expect is a heavy and prolonged correction, whether or not the long-term bull market in gold and silver is over.
Alright, so what other evidence is to hand that supports a cautious stance? We have already observed the underperformance of gold and silver stocks relative to the Precious Metals, a particularly sad example being provided by Coeur d’Alene (code CDE), and the “dead in the water” appearance of the juniors, many of which have not risen at all despite impressive gains in gold and silver. Mr Bob Moriarty of www.321gold.com sees this disparity being resolved by a big rise in Precious Metals stocks, but the other way it could be resolved of course is for gold and silver to drop a lot, which now looks to the writer more likely. A bearish looking Rising Wedge pattern is evident on the HUI index chart and the XAU index chart looks increasingly toppy. The opinion has been expressed that these indices are a poor reflection of the recent strength of many stocks, as they include underperforming stocks with extensive interests in South Africa, such as Anglogold, Gold Fields and Harmony Gold Mines (South Africa is heading in the same general direction as Zimbabwe). True or not the same explanation cannot be tendered for the increasingly toppy looking Canadian Venture Exchange Index.

The Canadian Venture Exchange Index looks particularly ominous. It appears to be marking out a Head-and Shoulders top above a clear line of support at 2300. We can see this on its long-term chart, and also the persistent heavy volume as the suspected top area has formed during a period of over 2 years. Although the heavy volume of the past couple of years is normally indicative of a top, as it means that a large number of investors are realizing big gains by selling to a large number of investors who are buying at historically high prices, there is a paradox here as the Accumulation-Distribution and On-balance Volume lines (not shown) have continued to climb steadily as this potential top area has formed, although, as we have witnessed on a number of occasions they could suddenly turn sharply lower and drop with the index. Clearly, if the 2300 support level fails we can expect to see a steep drop and the minimum downside target in the event that this happens is the 1600 area, which would mean heavy across-the-board losses in Canadian stocks.
The S&P500 index in Swiss Francs chart, which is similar to the Euro chart, shows that the Precious Metals sector can expect little help from the broad stockmarket in the near future. The general stockmarket has embarked on another downtrend, and despite the talk of it rising from a “base area” on the straight dollar chart, there is no sign of a base on this chart.

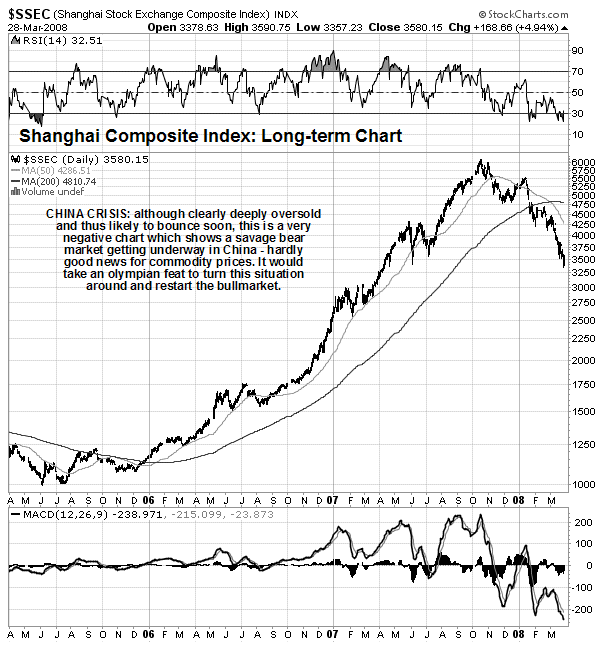
A negative factor for commodities generally is the developing bear market in Chinese stocks which implies that a significant economic slowdown will start to make itself felt in about 6 months in China.

It is recognized that this update is not going to be at all popular with gold and silver bulls, and that will include some of the many subscribers to the site but as the writer’s Prime Objective is to assist readers in making money, or at least not lose it, it is considered better to sacrifice immediately popularity to the cause of objectivity. In any case, experienced traders know that you make money in the market not by fighting it but by aligning yourself to its trends, and you can often make gains more rapidly in a falling market as markets tend to drop twice as fast as they go up. Pragmatic traders will therefore seek to capitalize on the major corrective phase that now appears to be beginning by means of shorting selected weaker stocks, such as South Africans, or Put options, and be ready to reverse position once it looks to have run its course. As the move unfolds, there will be periods when it will become extremely oversold, leading to countertrend rallies along the way which can be exploited by means of the strongest stocks, which opportunities we will aim to highlight. Thus, we were content to realize gains of from 30% to 70% in gold stock Call options in the middle of the week, made in the space of 2 trading days, when we exploited the bounce from the deeply oversold short-term condition resulting from last week’s plunge. Gold rallied from a deeply oversold position last week, as predicted, and is now once again vulnerable to a steep decline. Before this occurs we may some further insipid upside action, but this is considered unlikely, so it is thought better to position yourself for another sharp decline.
For reasons set out in full in the Gold Market update we are now adopting a more cautious tack with both gold and silver than that expressed in last week‘s updates, with the steep drop in the Precious Metals over a week ago now being considered to mark the start of a deeper and more prolonged corrective phase.
Although both gold and silver remain within intermediate uptrend channels that did not fail as a result of the plunge, even though gold’s trendline was tested, they both broke down from parabolic accelerating uptrends, with silver’s failed parabolic uptrend being shown on the 1-year chart here. What normally happens after the failure of such an accelerating uptrend is a lengthy straggling correction, the early stages of which can be violent, as we have just seen, or a flat-out bear market. Thus both gold and silver’s intermediate uptrends are expected to fail in due course, with an obvious initial target for the silver correction being the support level in the $15.00 - $15.50 area, not far above its rising 200-day moving average. Silver rallied from a deeply oversold position last week, as predicted, and is now once again vulnerable to a steep decline. Before this occurs we may some further insipid upside action, but this is considered unlikely, so it is thought better to position yourself for another sharp decline.

As set out in the Gold Market update, whether or not the corrective phase in gold and silver morphs into a full blown bear market, will probably depend on whether or not a bear market develops in commodities generally, and that will depend on whether or not powerful deflationary forces continue to be offset by the powerful inflationary forces in the system which are already glaringly obvious. This in turn will depend on the future actions, or perhaps reactions of the Fed and the world’s Central Banks. With ominous bearish patterns appearing on many commodity charts and on many stock index charts, as well as on many individual stock charts, caution is the watchword for the immediate future.


