Gold’s Bottom Could Be Investors’ Lost Treasure
 share
share
 share
share
 share
share
 share
share
 share
share

Get ready, gold bulls: The precious metal could be close to finding a bottom.
The price of gold fell back below $1,200 an ounce again last week as the U.S. dollar advanced following another federal funds rate hike. The precious metal logged its sixth straight month of declines, its longest losing streak since 1989.
That gold’s not trading below $1,150 is, I believe, remarkable. There’s a lot motivating the bears right now. Besides a stronger dollar and higher interest rate, stocks are still going strong, buoyed by record buybacks and massive inflows into passive investment products. In the week ended September 20, investors poured as much as $34.3 billion into ETFs, taking year-to-date inflows to nearly $215 billion, according to FactSet data.
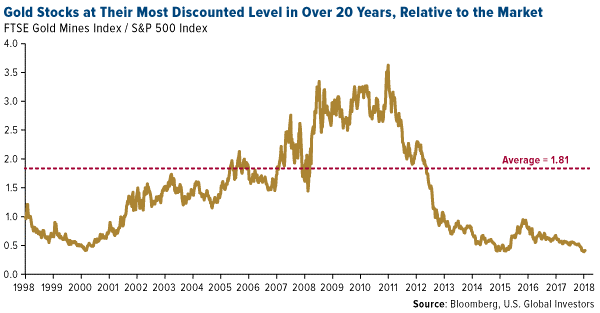
This makes gold mining stocks look especially attractive by comparison. Relative to U.S. blue chips, the FTSE Gold Mines Index is now at its most discounted level in over 20 years.
Gold Industry Ready for Consolidation?
There are other signs that a bottom is near.
For one, Vanguard just restructured its precious metals mutual fund, slashing its exposure to the industry from 80 percent to only 25 percent. This means the world’s largest fund company will no longer offer its investors a way to participate in a potential rally in metals and mining stocks.
The last time Vanguard made a change like this, it coincided with a huge run-up in metal prices. In 2001, gold was just as unloved as it is now, prompting Vanguard to drop the word “Gold” from what was then the Gold and Precious Metals Fund.
Bad move—the precious metal went from under $300 an ounce to as high as $1,900 in September 2011.
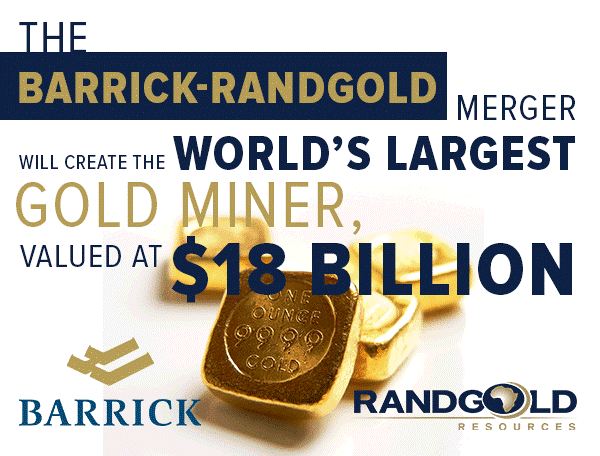
Last week, mining giants Barrick Gold and Randgold Resources announced an $18 billion merger that, once complete, will create the world’s largest gold producer. An “industry champion for long-term value creation,” according to BMO Capital Markets, the resultant company will “operate five of the 10 ‘tier one’ gold mines on a total cash cost basis and possess numerous projects with potential to” deliver sustainable profitability.
Historically, a telltale sign that an industry has found a bottom is consolidation. Just look at the wave of mergers and takeovers in the then-struggling airline industry following the financial crisis.
Other financial firms and analysts also find the Barrick-Randgold news positive, for the two senior producers as well as metals and mining as a whole. Scotiabank believes the merger “improves [Barrick’s] overall asset quality, balance sheet, free cash flow profile, technical expertise and management team, with no takeout premium paid.” The deal, says the Royal Bank of Canada (RBC), “could spur a pick-up in M&As, which in our view could result in a turnaround in mining equity performance.”
Good news indeed as inflation continues to ramp up. The price of Brent oil, the international benchmark, closed above $80 a barrel last week for the first time since November 2014. That’s an incredible threefold increase from its recent low of $27 a barrel, set in January 2016.
The Incredible Shrinking Stock Market Is Shrinking Even Faster
As you already know, one of the key reasons why gold has been so highly valued for centuries—as a commodity and currency—is its scarcity. It makes up roughly 0.003 parts per million of the earth’s crust. According to the World Gold Council (WGC), an estimated 190,040 metric tons of the stuff have been mined since the beginning of time, leaving only 54,000 metric tons in the ground for producers to dig up, at greater and greater expense.
“Peak gold,” as some experts call it, is a real concern, one that could rocket the price of the yellow metal into the stratosphere on a supply-demand imbalance.
Scarcity, after all, is what’s helping to drive the equity bull market even higher right now. Over the past 20 years, the number of listed companies has steadily been shrinking, mostly as a result of tougher securities regulations.
And now, those companies—flush with cash thanks to last year’s corporate tax reform—are buying back their own stock at record and near-record levels.
Just how much? I shared with you recently that in the June quarter alone, S&P 500 companies spent a record $190.6 billion on stock repurchases, an increase of almost 60 percent from the same quarter a year ago. Apple led the pack, taking $21.9 billion worth of stock out of circulation. That’s down slightly from the record $22.8 billion in the first quarter.
In general, Wall Street likes buybacks, which lower the number of shares outstanding. As a result, earnings per share (EPS) and dividends available per share increase even when there isn’t any profit growth.
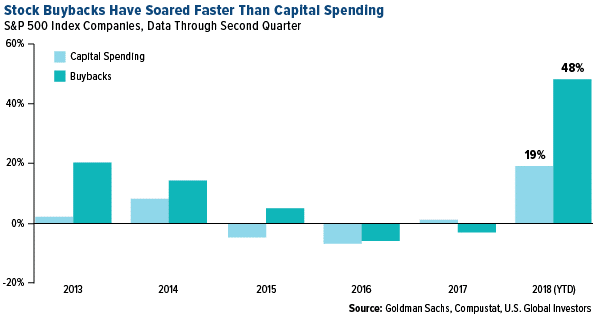
But there are a couple of issues. First, buybacks require capital that could have otherwise been spent on investing, upgrading equipment, giving workers raises and the like. For the first time in 10 years, according to Goldman Sachs, buybacks have outstripped capital spending so far in 2018. The S&P 500 is already trading at overinflated prices, meaning companies like Apple are buying high.
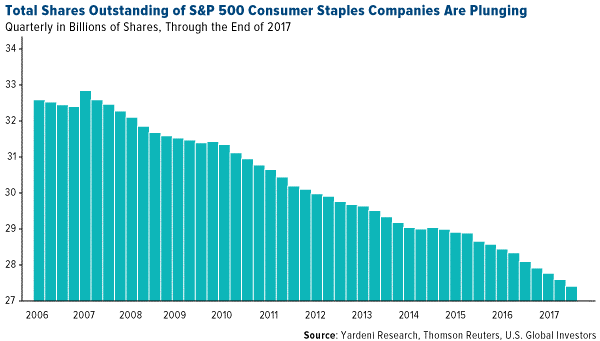
Second, buybacks take shares off the market. Over the past decade, companies have bought back $4.4 trillion as historically low interest rates created, for some, a more favorable environment to float debt instead of equity. Below, I chose to highlight the consumer staples sector because the decline in shares since 2006 has been so dramatic, falling from around 32.5 billion shares to 27.5 billion shares—a decrease of more than 15 percent.
Today, “not enough shares are being issued to offset those being withdrawn from circulation,” according to Reuters. Net equity supply turned negative for the first time ever in 2016, and it could end in negative territory again by the end of this year.
Coupled with the ticking passive index bomb I wrote about earlier in the month, fundamental investing is changing. It’s hard to say where this will end—when there’s only one share of Apple left? Prices would explode, and investing would become even more out-of-reach for many than it already is today.
Click here to get my thoughts on why I think the market could correct between 10 percent and 20 percent early next year, and what investors can do now to prepare!
All opinions expressed and data provided are subject to change without notice. Some of these opinions may not be appropriate to every investor.
The S&P 500 Index is a widely recognized capitalization-weighted index of 500 common stock prices in U.S. companies. The FTSE Gold Mines Index Series encompasses all gold mining companies that have a sustainable and attributable gold production of at least 300,000 ounces a year, and that derive 75% or more of their revenue from mined gold.
Free cash flow represents the cash a company can generate after required investment to maintain or expand its asset base. Total cash cost refers to the cost per payable unit of metal sold during the life of the commercial operations of a mine. There is no guarantee that the issuers of any securities will declare dividends in the future or that, if declared, will remain at current levels or increase over time.
Holdings may change daily. Holdings are reported as of the most recent quarter-end. None of the securities mentioned in the article were held by any accounts managed by U.S. Global Investors as of 6/30/2018.
U.S. Global Investors, Inc. is an investment adviser registered with the Securities and Exchange Commission ("SEC"). This does not mean that we are sponsored, recommended, or approved by the SEC, or that our abilities or qualifications in any respect have been passed upon by the SEC or any officer of the SEC.
This commentary should not be considered a solicitation or offering of any investment product.
Certain materials in this commentary may contain dated information. The information provided was current at the time of publication.
*********
share
share
share
share
share
 Frank Holmes is the CEO and Chief Investment Officer of U.S. Global Investors. Mr. Holmes purchased a controlling interest in U.S. Global Investors in 1989 and became the firm’s chief investment officer in 1999. Under his guidance, the company’s funds have received numerous awards and honors including more than two dozen Lipper Fund Awards and certificates. In 2006, Mr. Holmes was selected mining fund manager of the year by the Mining Journal. He is also the co-author of “The Goldwatcher: Demystifying Gold Investing.” Mr. Holmes is engaged in a number of international philanthropies. He is a member of the President’s Circle and on the investment committee of the International Crisis Group, which works to resolve conflict around the world. He is also an advisor to the William J. Clinton Foundation on sustainable development in countries with resource-based economies. Mr. Holmes is a native of Toronto and is a graduate of the University of Western Ontario with a bachelor’s degree in economics. He is a former president and chairman of the Toronto Society of the Investment Dealers Association. Mr. Holmes is a much-sought-after keynote speaker at national and international investment conferences. He is also a regular commentator on the financial television networks CNBC, Bloomberg and Fox Business, and has been profiled by Fortune, Barron’s, The Financial Times and other publications. Visit the U.S. Global Investors website at http://www.usfunds.com. You can contact Frank at: [email protected].
More from Gold-Eagle