Market Update For Early September
I need to take a break in my market commentary. The markets are boring me to death, and I fear most of my readers are finding reading my commentaries as boring as I do writing them. So I’m going to take the next two weeks off, and will come back on the weekend of September 25th to 27th.
Thursday this week the Dow Jones saw a day of extreme volatility, a -2.78% decline from Wednesday’s close. This was the first 2% day since July 14th when the Dow Jones saw a +2.13% day.
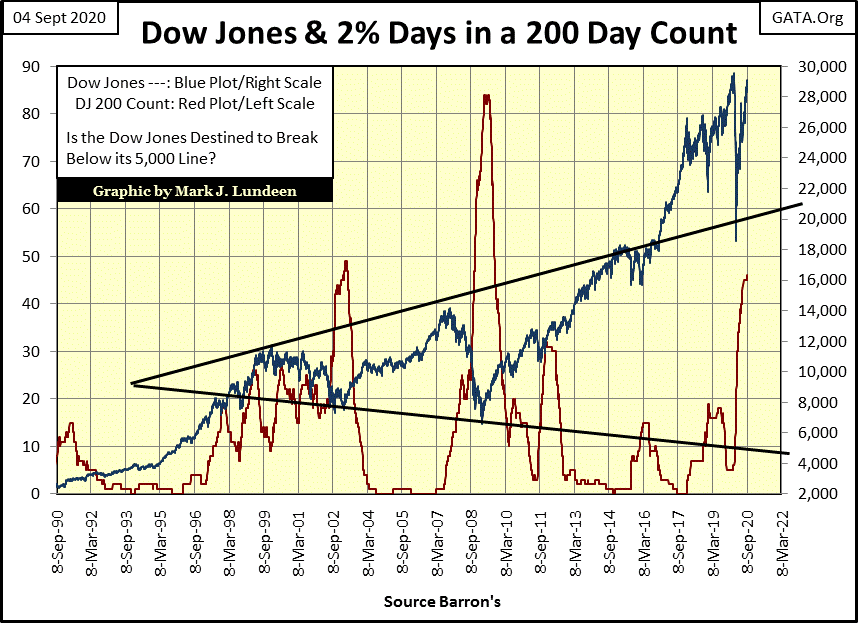
At week’s close the 200 count for the Dow Jones (number of Dow Jones days of extreme volatility within the past 200 NYSE trading sessions) closed up one to forty-six. An extreme day of volatility is a day the Dow Jones moves (+/-) 2%, or more, from a previous day’s closing price. As I use the term, the 2% is a threshold value. So, a daily move of (+/-) 6% or more is also considered a 2% day, and since 21 November 2019 (200 NYSE trading sessions ago) the count has increased to forty-six 2% days.
As seen below, a 200 count of forty-six for the Dow Jones is the third highest count in the past thirty years. But unlike the high counts of 2002 & 2009, which corresponded to deep bear market bottoms, our high count occurred as the Dow Jones was within 1.53% of a new all-time high. What’s with that?
I think the current high count for the Dow Jones, coming so close to a new all-time high, could be best thought of as finger prints left behind at a crime scene. And what crime would that be?
In the chart below I’ve always strongly suggested, if not actually said Doctor Bernanke’s QE1-3 were criminal acts. But Jerome Powell’s “Not QE#4” is a monetary-capital crime that reflated last winter’s Dow Jones -37% market crash (a Big Bear Market bottom) back to only 1.53% from a new all-time high just this week on Wednesday’s close. The crash and recovery happened so quickly (in only 144 NYSE trading sessions from the Dow Jones’ last all-time high of February 12th), its 200 count didn’t have time to clear out the stale 2% days.
This has never happened before. So too is seeing the Federal Reserve “injecting” $1.38 TRILLION DOLLARS into the financial system in a single month as it did last April (chart below). Quite a difference from the $2.98 BILLION A MONTH the Federal Reserve typically “injected” into the financial system before Doctor Bernanke’s QE#1.
Question: how long will last April’s “injection” of $1.38 trillion remain a market record? At least for as long as the Dow Jones remains above the lows of last March: 18.592. But don’t quote me on that. Should (when?) the Dow Jones break below the lows of last March, just you watch what the FOMC does to once again “stabilize market valuations” in the chart below!
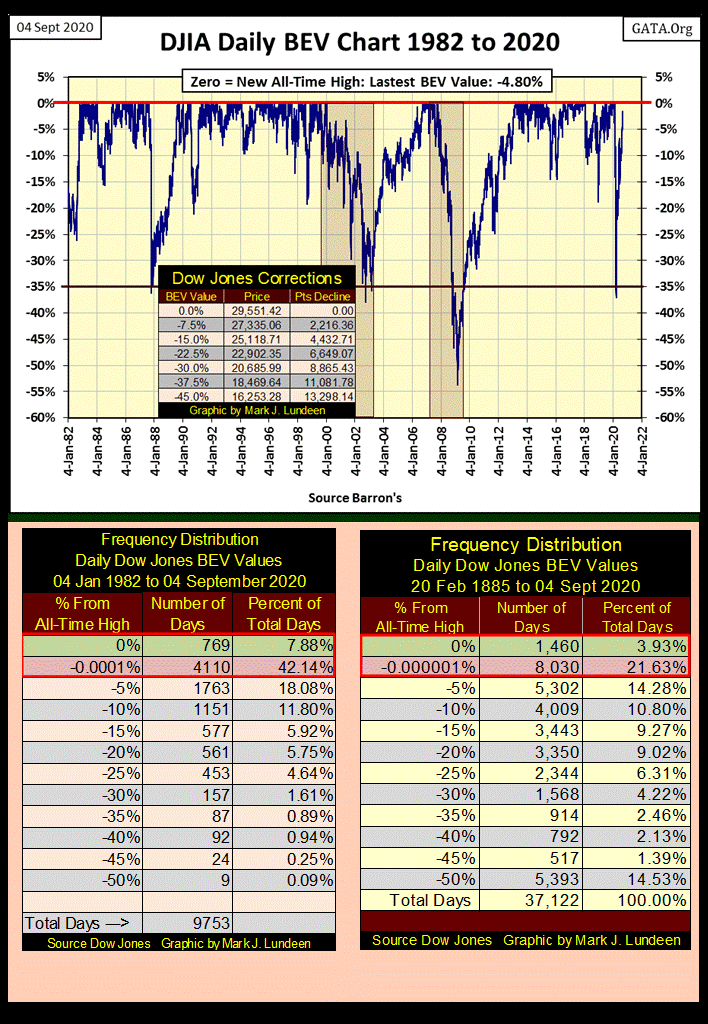
That’s something to watch for in the months to come. But returning to this week, here’s the Dow Jones BEV chart with its corresponding frequency table for the BEV data seen plotted below.
The Dow Jones began its current bull market on 12 August 1982 as it bottomed at 776.92. Two days later it broke above 800 and never looked back. Last February 12th the Dow Jones saw its last BEV Zero (last all-time high), or 29,551.42 in dollars. That’s an increase by a factor of 38 over the past thirty-eight years.
Since January 1982 the Dow Jones has seen four episodes of deflating market valuations greater than -35% in the BEV chart below. Two were actual bear markets; the 2000-02 NASDAQ High-Tech 38% bear, and the 2007-09 sub-prime mortgage 54% bear market. Then there are the October 1987 & and our Feb-March 2020 market panics, where out of nowhere the Dow Jones deflated by over 35%.
Still, for the past thirty-eight years, the Dow Jones has seen lots of BEV Zeros in the chart below. And how many BEV Zeros are seen in the BEV chart below? Moving on to this chart’s BEV frequency distribution table (left side) below, the Dow Jones has seen 769 new daily all-time highs since January 1982, or 7.88% of all daily closes.
Daily closes just short a new BEV Zero down to -4.99% from one are found in the -0.0001% row. I call daily closes in this row in scoring position, of which 4110 daily closes since January 1982 or 42.14% of all daily closings since January 1982 have been in scoring position. Together, these two rows contain 50.02% of all Dow Jones daily closings since January 1982.
To understand the significance of this, I’ve placed another frequency table on the right containing every Dow Jones daily close since 20 February 1885 for a comparison. For the past 135 years, Dow Jones closings at new daily all-time highs and within 5% of one in only 25.56% of all daily closings, half of that since January 1982. I believe I’ve made my case that since January 1982, market performance for the Dow Jones has been anomalous, a performace not likely to be repeated in the years and decades to come.
Below the Dow Jones is plotted with its 52Wk High & Low lines. The rebound off the Dow Jones’ March lows is impressive. But after this week’s Thursday and Friday’s market action, where in two days the Dow Jones dropped just short 1000 points, its fair to wonder what it will do next; push up its 52Wk High or push down it 52Wk Low line in the chart below.
Personally, I’m still expecting the Dow Jones to break above 30,000 in the months to come. But who knows what is to happen? It would be real market history should Wednesday’s close, just 1.53% from a new all-time high proved to be this advance’s high before it turned down again to test the lows of last March.
President Trump has made some powerful people very angry at him. If they can, they’d love to see the Dow Jones crashing before the November elections. So, I can’t rule this out either.
Next is my table listing this week’s BEV values for the major market indexes I follow. In last week’s first three trading sessions, the market saw some new all-time highs, then came Thursday and Friday where Mr Bear crashed the party.
These end of the week losses are significant. The NASDAQ 100 (#11) lost 6.43% in just two days. The S&P 500 (#2) lost 4.30%. The only index up last week was the Dow Jones Transports (#1).
I note the XAU (#19) has remained above the NASDAQ Banks (#20) this week. We’ll know when the advance in gold, silver and the precious metals miner resume when the XAU advances above the NYSE Financial index (#18). Hopefully we’ll see this by the end of September.
Next is gold’s Bear’s Eye View. Gold closed down this week, but the bears still haven’t forced it to correct by double-digit percentages. Even should gold correct down to its BEV -15% line below, I’d remain positive on gold and silver, but I believe the bottom is in for this correction. By October we’ll know if I’m right or wrong.
Gold in its step sum table below closed the week with its 15 count at a negative value, so is no longer overbought. Since August 6th when gold’s 15 count was a historic +13, it has seen only nine daily advances out of the past twenty-one trading sessions. And after all those down days the bears could force gold down by only 6.25% from its last all-time high at the close of the week.
I’d say gold is ready for its next advance. What it actually does in the weeks to come we’ll just have to wait to see, but seeing gold no longer overbought is a very positive development in the market.
Mark J. Lundeen
********


