Sentiment Speaks: One Of The Best Opportunities in 2024 Will Slow Into The Middle Of 2025
 share
share
 share
share
 share
share
 share
share
 share
share
When I am asked about my view as to how markets work, I try to simplify it to the lowest common denominator. So, while many will express their opinion on market drivers in relation to the Fed, or interest rates, or GDP, or employment, or other similar economic factors, I say that market history and current market studies suggest that those are meaningless to the bigger trends.
To put it in its simplest terms, when market participants are most bearish, markets tend to bottom and begin a rally. And, when market participants are most bullish, markets tend to top and begin a decline. From a theoretical standpoint, it really is that simple.
One of the best more recent examples to which I can point is what occurred as we were approaching the bottom in the Covid Crash in March of 2020. The bearishness at the time was so extreme and ubiquitous, it felt even worse than the bottom of the market at the end of the Great Financial Crisis of 2008-2009. And, when we struck the bottom in March of 2020, it surprised everyone in the market. Well, almost everyone (smile).
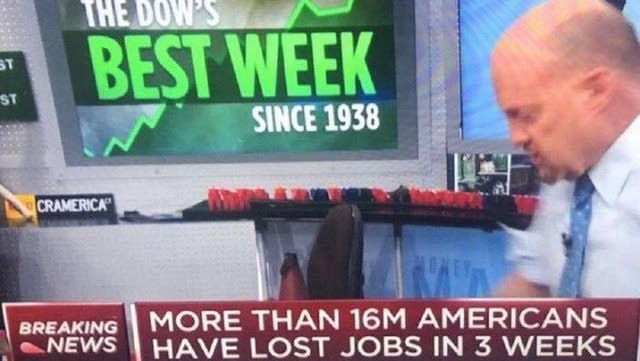
As you can see from this picture taken from Jim Cramer’s show as we began to rally off those lows, that rally made no sense to anyone because of all the bad news coming out at the time. We were seeing economic shut-downs worldwide, the death rates were hitting their highest levels, and economic reports were hitting record levels, such as the unemployment numbers. Yet, it was exactly at that bearish extreme that the market bottomed and began one of the strongest rallies in market history.
In fact, at the time, I was focusing upon the 2200SPX region as a bottoming target, with an expectation that the market will rally to 4000+ thereafter. And, of course, due to the extreme negative sentiment, many were not able to focus upon the contrary indication presented by market sentiment as we were striking the lows. And, I use this comment as the perfect example of market views at the time:
“Here is the 2200 exactly that you said the S&P would bottom at before taking the trip back up to 4,000... What do you want to bet the ECONOMY is going to pull it down a lot further and that 4,000 is a lot further away than your charts ever said... my own resolution is that this market has a lot further to fall because it is now following the economy, which it long divorced itself from; whereas Avi doesn't believe the economy ever means anything to stocks and has told me so several times last year... So, you have that common sense view, or you can believe Avi's chart magic will get you through all of that and is right about a big bounce off of 2200 all the way back up to 4,000.”
But, there are some people who do understand this simple market dynamic, such as Alan Greenspan, the former Chairman of the Federal Reserve, who noted many years ago:
“It's only when the markets are perceived to have exhausted themselves on the downside that they turn.”
And, while this sounds like a very simple perspective in theory and most seem to agree with this premise, many do not understand how to actually implement it in practice. And the main reason many do not is because they are focusing on the wrong market dynamics. As I stated above, most are focused upon economic factors, whereas they should be focusing upon market sentiment.
In fact, I used to be one of those that were purely focused upon economic factors, at least based upon the manner in which I was initially taught to approach the market.
For those that do not know my background, allow me to explain. I graduated college with a dual major in both economics and accounting. I went on to pass all 4 parts of the CPA exam in one sitting, something which only 2% of those taking the exam are able to achieve. I then went on to complete law school in two and a half years, and graduated cum laude and in the top 5% of my class. I then went on to NYU for a masters of law in taxation. I became a partner and National Director at a major national firm at a very young age, where I worked to organize very large transactions. So, when I tell you that I understand the fundamentals of economics, business, accounting, and balance sheets, you can believe me.
Yet, when I approached investing in the market with all this background of understanding businesses, economics and balance sheets, I was no better than the average investor, and sometimes even worse. It was not until I learned more about market psychology that I began to maintain on the correct side of the market the great majority of the time. In effect, I had to ignore everything I learned about economics, businesses and balance sheets, and predominantly focus upon investor psychology in order to make more sense of market action.
It was not until this point that I started to realize how preposterous the Efficient Market Hypothesis was in real life due to its underlying illusory assumptions. It now reminds me of a joke a friend of mine told me about economists:
Two economists fell into a 20-foot ditch. As they looked around for a way out, they each attempted to climb out of their predicament, but to no avail. After struggling for a way out for about 15 minutes, a newly found excitement regarding a perceived solution came upon the face of one of the economists. He then turned to his compatriot, and proclaimed in excitement: “I figured a way out . . . Assume a ladder!”
It was during my search for a better way that I stumbled upon the work of Ralph Nelson Elliott and Robert Prechter and finally began to understand market dynamics. In fact, the most eye-opening book I have ever read about markets was Robert Prechter’s The Socionomic Theory of Finance. I cannot more highly suggest this book to any and all investors who want to really understand market dynamics, as it will change the manner in which you look at the market forever.
For me, my personal discovery of this methodology was my “Matrix moment.” For those that have seen the movie The Matrix, you may recall Morpheus’s offer to Neo of choosing between taking the red pill or the blue pill. If Neo choose the red pill, he would see the real world and understand the false world presented by the Matrix. However, if he choose the blue bill, he would return to the false illusion of the Matrix and continue his life in its prior oblivious state. I believe choosing to buy The Socionomic Theory of Finance offers you a similar choice.
Within that book, I would say that the mathematician Benoit Mandelbrot probably best summarized the transition market participants need to make:
“From the availability of the multifractal alternative, it follows that, today, economics and finance must be sharply distinguished . . .”
But, as Yoda proclaimed in The Empire Strikes Back, “you must unlearn what you have learned.”
If you are interested in how we apply these simple perspectives best, you can feel free to read the six-part series I penned a number of years ago:
Now, moving to the point I alluded to in the title of this article, I was actually referring to the precious metals market. As the main gauge of the stock market, the S&P500, is up 24% in 2024, most do not realize that gold is up 33%, silver is up 38% and GDX (the mining stock index) is up 44% during that same period of time.
While I was pounding the table about the potential move I expected in 2024 in the metals complex to the almost 9000 members of our services and almost 1000 money manager clients at the end of 2023, I even published my expectations at the end of 2023 in public articles. For example, on October 20, 2023, I penned my expectation for 2024 of a rally in gold to at least the 2400 region, with strong potential to rally as high as the 2700 region.
https://seekingalpha.com/article/4642100-sentiment-speaks-do-you-care-about-gold-well-you-should
At the time, this is what my GLD chart was projecting:
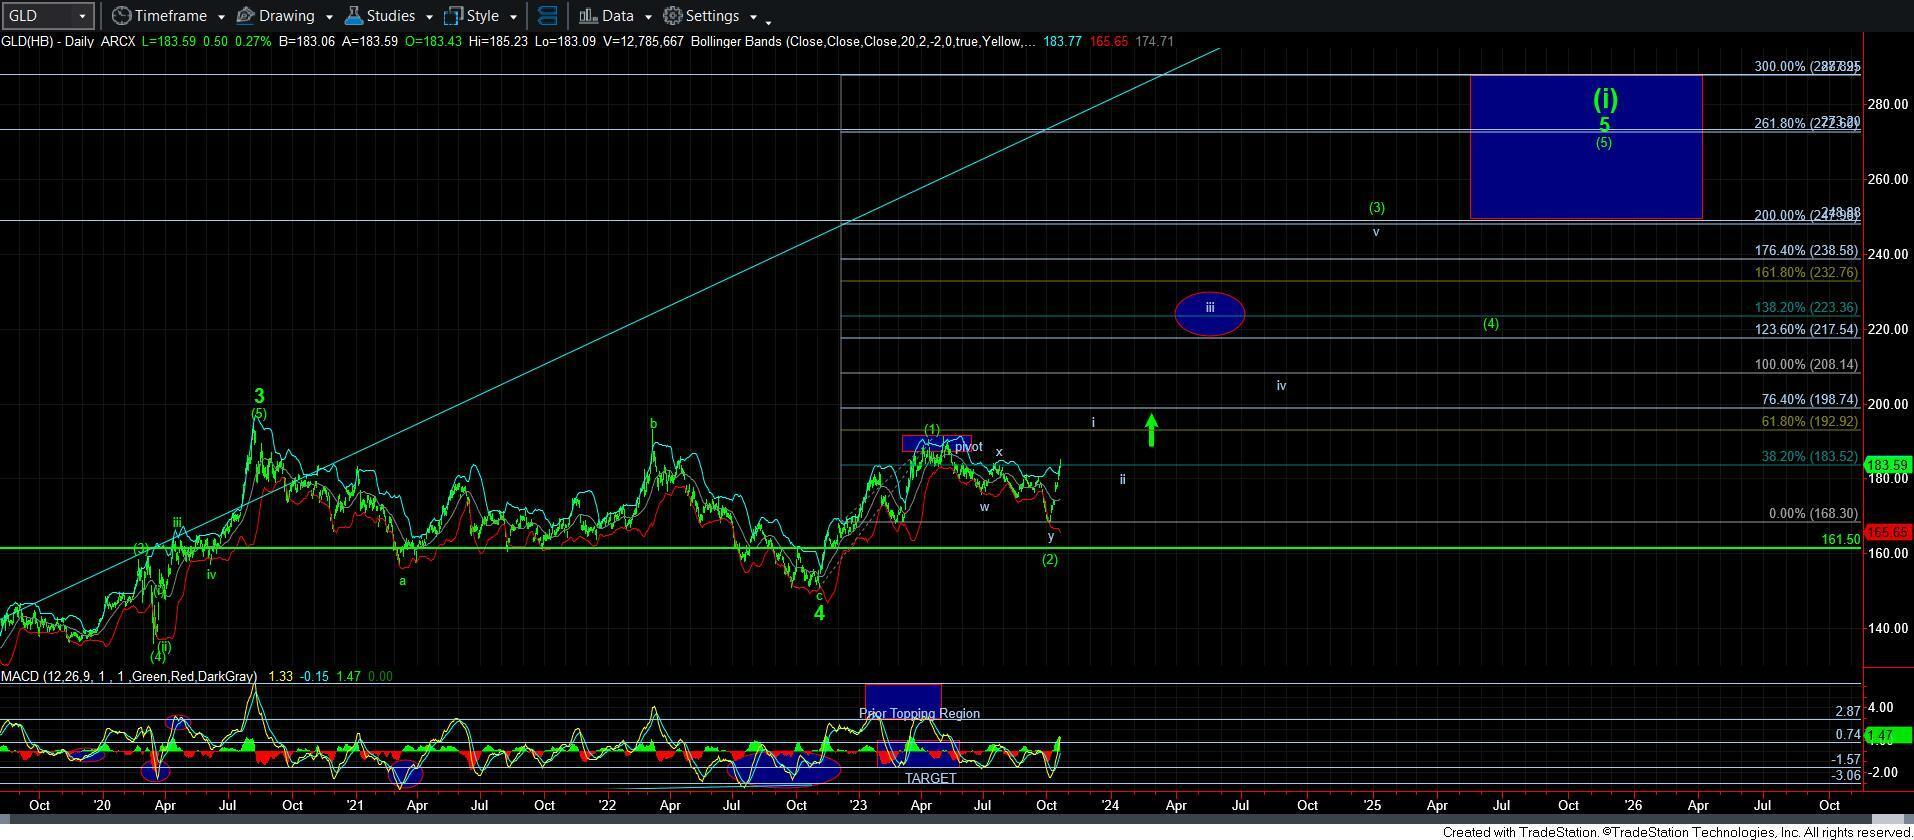
Yet, as the market rally developed, I had to adjust my targets a bit higher, adjusting the wave [3] target to the 273-275 region (with an uppermost extension target in the 288 region). As we can see, we are now approaching that target, which I expect to be struck as we head into early 2025.
However, the title to this article also alludes to my view of a likely slow down in 2025, as I expect that we will begin a multi-month pullback in the gold market as we look towards the middle of 2025. I want to add a warning here that my “timing” is a general guestimate of my expectations. Rather, it is the structure of the rally that guides us in real time, and when the structure of wave [3] completes, it will be at that point in time that I will warn my clients to expect a multi-month pullback in wave [4].
But, since Elliott Wave analysis is a 5-wave construct, once we complete wave [4], I will then expect a wave [5] rally which will target the 3300-3400 region in gold, as per my current calculations. But, before you consider placing that expectation into stone, I want to note that 5th waves in the metals complex are often the strongest segment of the trend. So, before I place this expectation into stone, I want to see how that 5th wave takes shape before I am ready to call a potential topping point. And, that top I expect will likely be a multi-year top, which can set off a decade long correction and bear market in gold which can point us back down towards the 1000-1300 region in gold.
While this may sound quite extreme at this time, I can assure you it is a reasonable target based upon our methodology.
For those that may not remember, back in August of 2011, as gold was rallying parabolically during its last larger degree 5th wave structure and everyone was certain we were about to eclipse the $2,000 mark, I posted the following analysis in my first public analysis article:
https://seekingalpha.com/article/288823-a-different-perspective-on-a-top-for-gold
“Again, since we are most probably in the final stages of this parabolic fifth wave “blow-off-top,” I would seriously consider anything approaching the $1,915 level to be a potential target for a top at this time.”
And, while most thought this view to be rather crazy at the time, and I was told so quite unequivocally in the comments section of the article and follow up articles, one person asked me in a follow up article what was my expectation for a correction, to which I answered the $1,000 region.
As we now know, gold topped within $6 of my target, and then bottomed a little over 4 years later at $1,050, at which time we also called the low in real time.
In fact, on December 30th, 2015, I urged investors to be moving back into the metals complex, as we were looking for a long-term bottom to be struck imminently due to the significant bearishness evident in the market and our bottoming structure near completion:
“As we move into 2016, I believe there is a greater than 80% probability that we finally see a long term bottom formed in the metals and miners and the long term bull market resumes. Those that followed our advice in 2011, and moved out of this market for the correction we expected, are now moving back into this market as we approach the long term bottom. In 2011, before gold even topped, we set our ideal target for this correction in the $700-$1,000 region in gold. We are now reaching our ideal target region, and the pattern we have developed over the last 4 years is just about complete. . . For those interested in my advice, I would highly suggest you start moving back into this market with your long term money . . .”
So, in summary, our analysis is telling us that we likely still have higher to go as we look towards early 2025 in the metals complex. However, I expect a multi-month pullback to be seen in 2025 before the market continues higher to the conclusion of the rally which began in early 2016, which will then likely set off the next multi-year correction in the metals complex.
Now you have to ask yourself if you think I sound as crazy as many viewed me in 2011 and then again in 2016?
*******
share
share
share
share
share
 Avi Gilburt is a widely followed Elliott Wave technical analyst and author of ElliottWaveTrader.net, a live Trading Room featuring his intraday market analysis (including emini S&P500, metals, oil, USD & VXX), interactive member-analyst forum, and detailed library of Elliott Wave education. You can contact Avi at: [email protected].
More from Gold-Eagle